Century 21 People’s Choice Realty Inc., Brokerage
120 MATHESON BLVD E #103
MISSISSAUGA, Ontario
L4Z 1X1


Kitchener, N2B 2C8
$859,900$000000
Listed by SHAW REALTY GROUP INC..
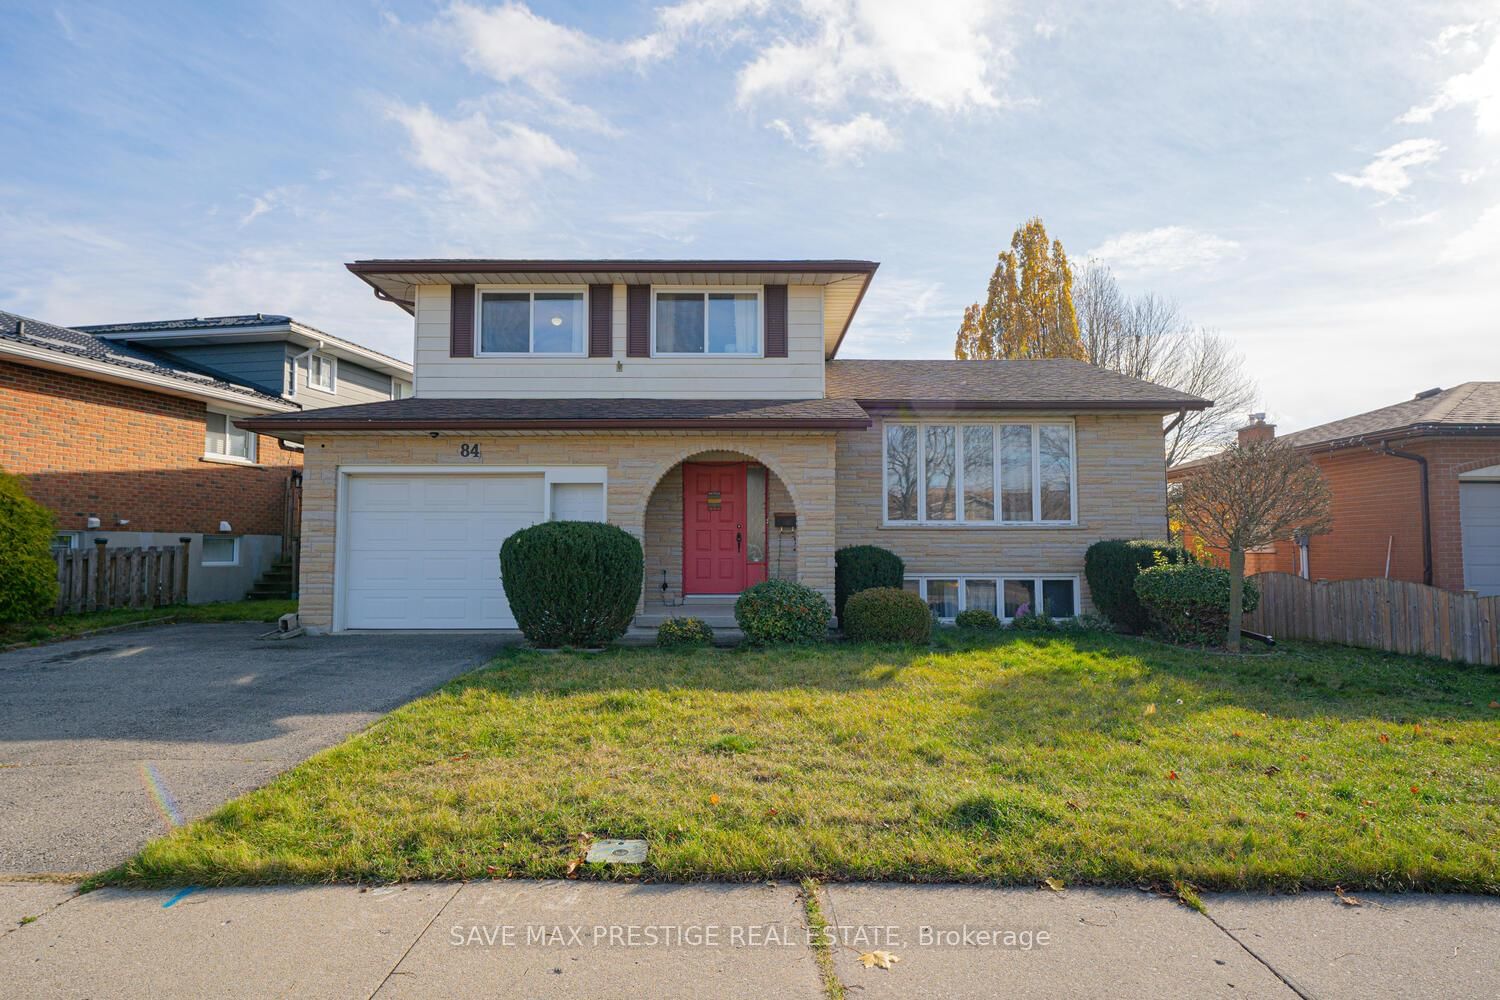
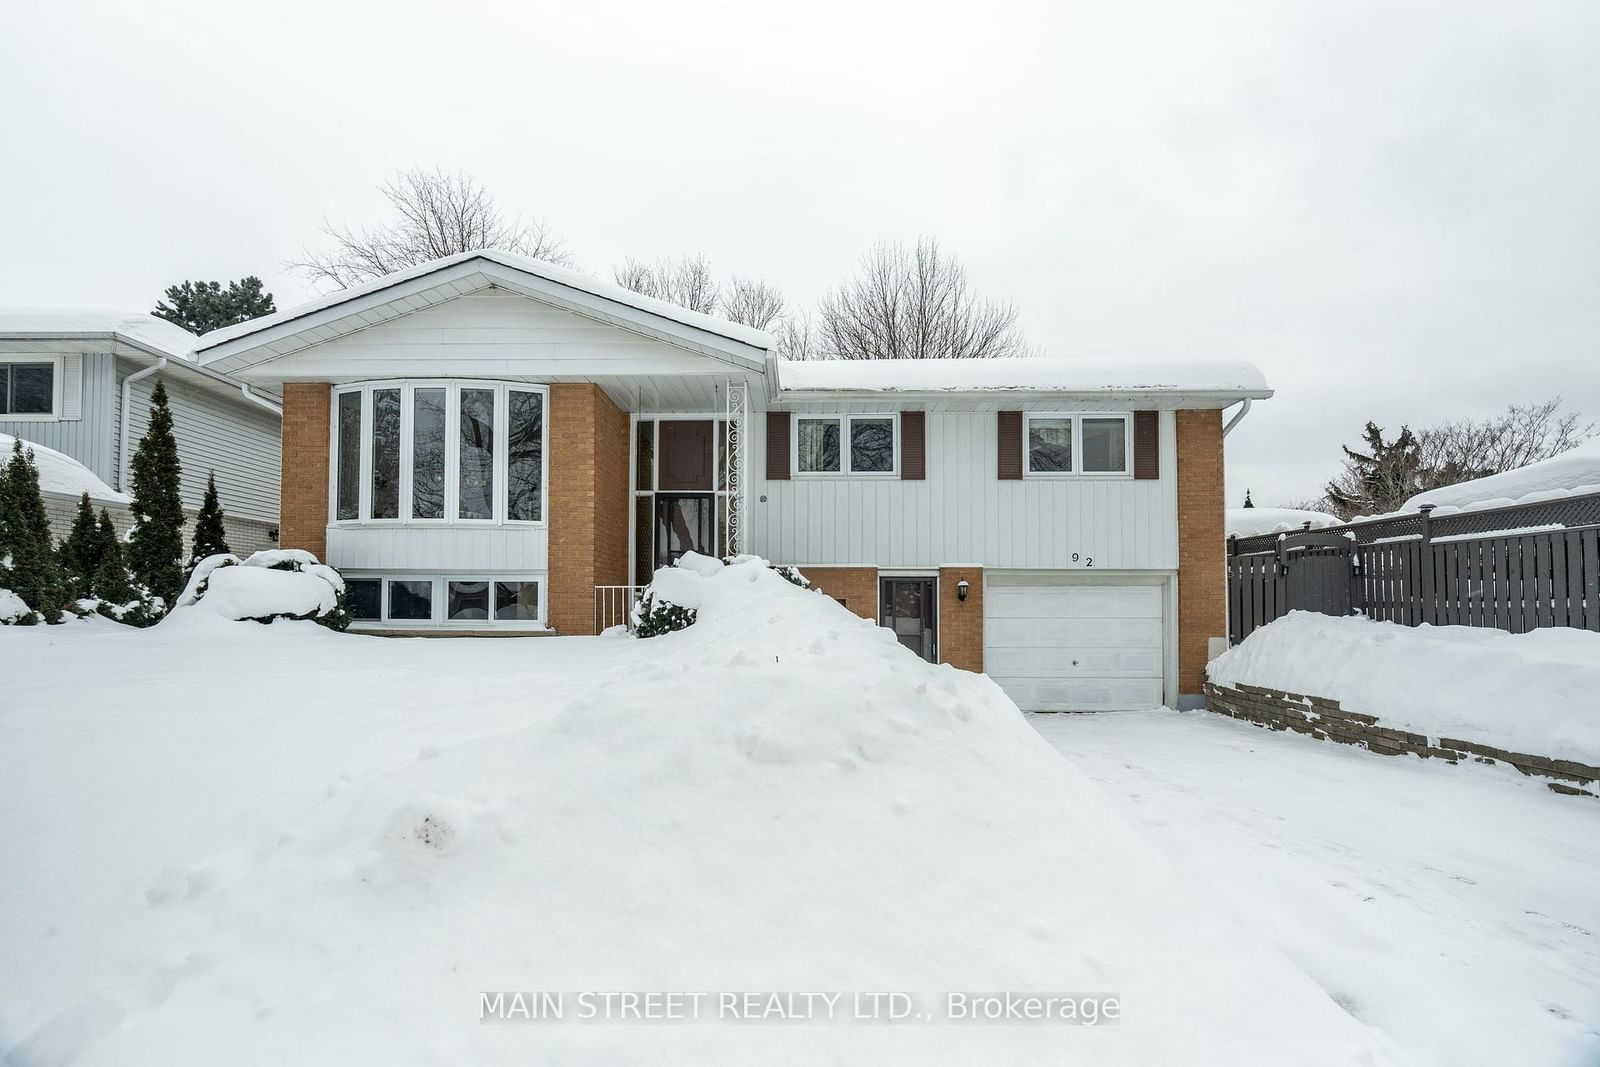
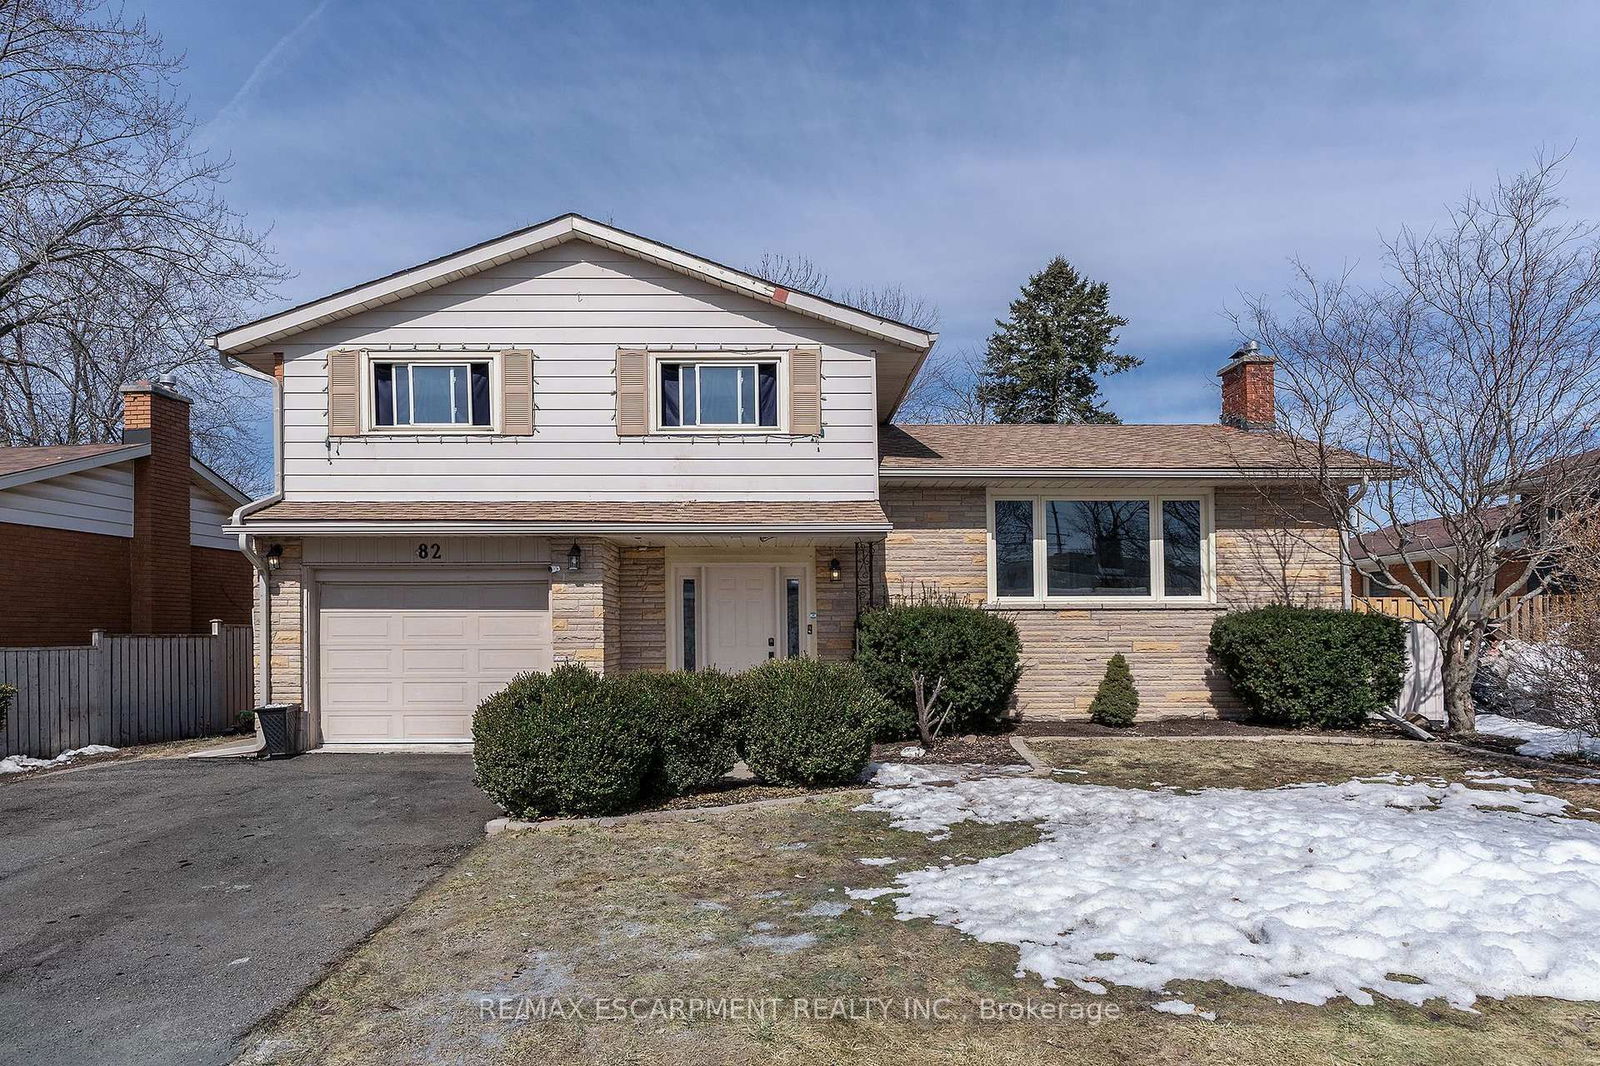
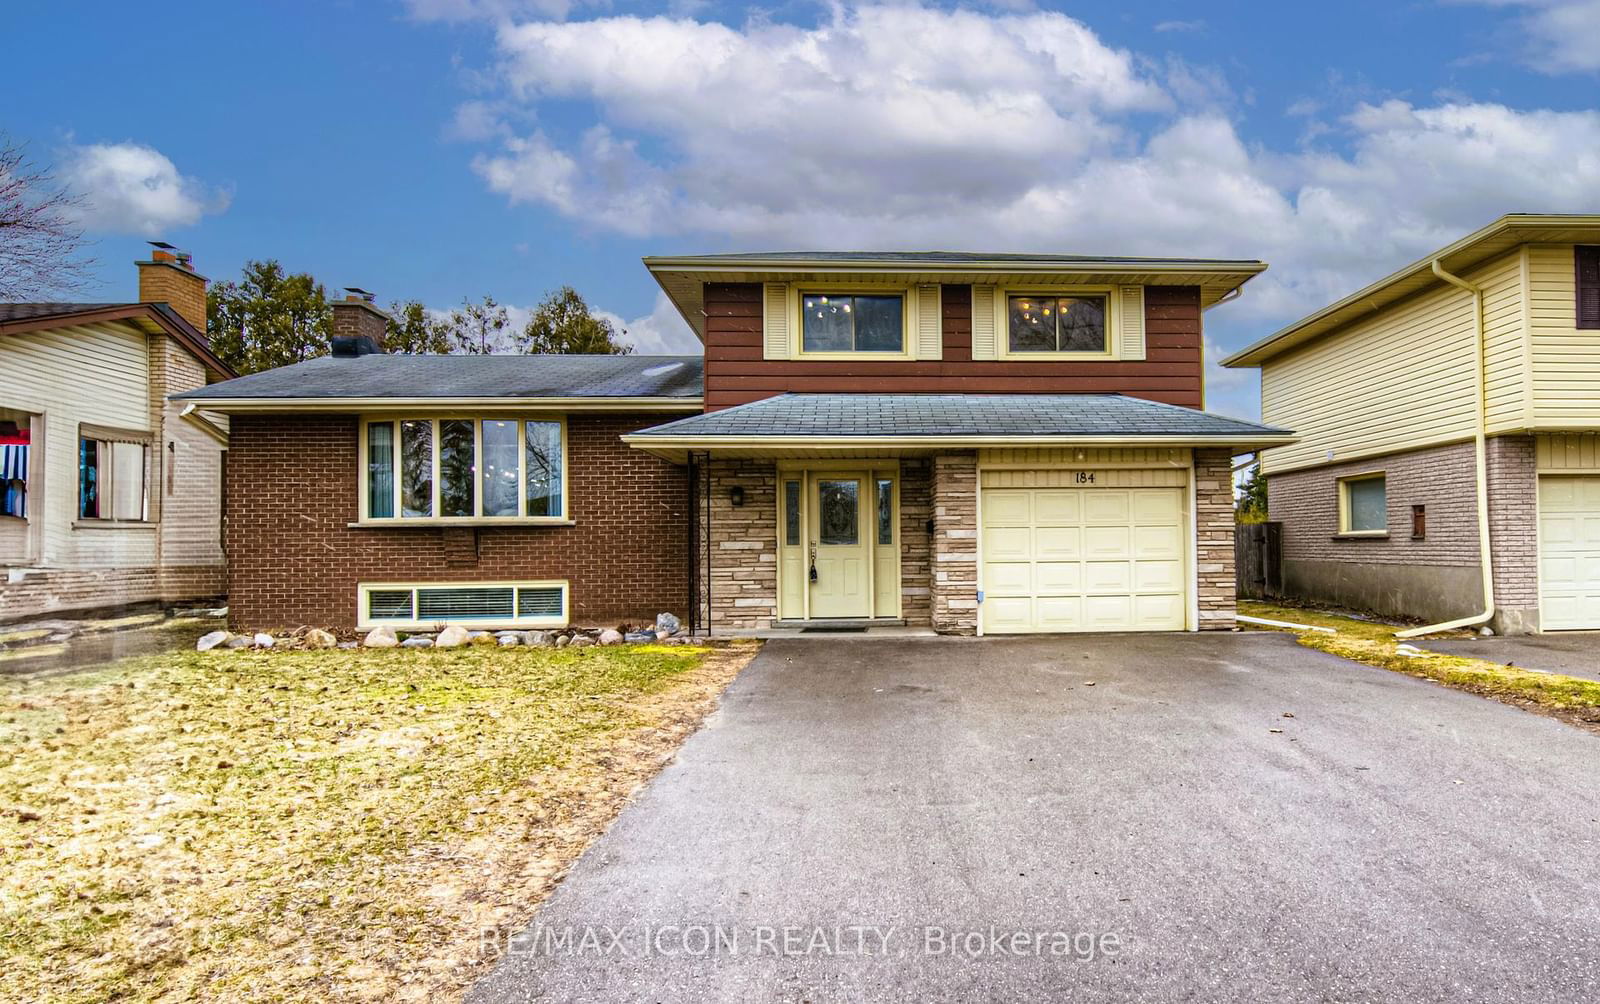
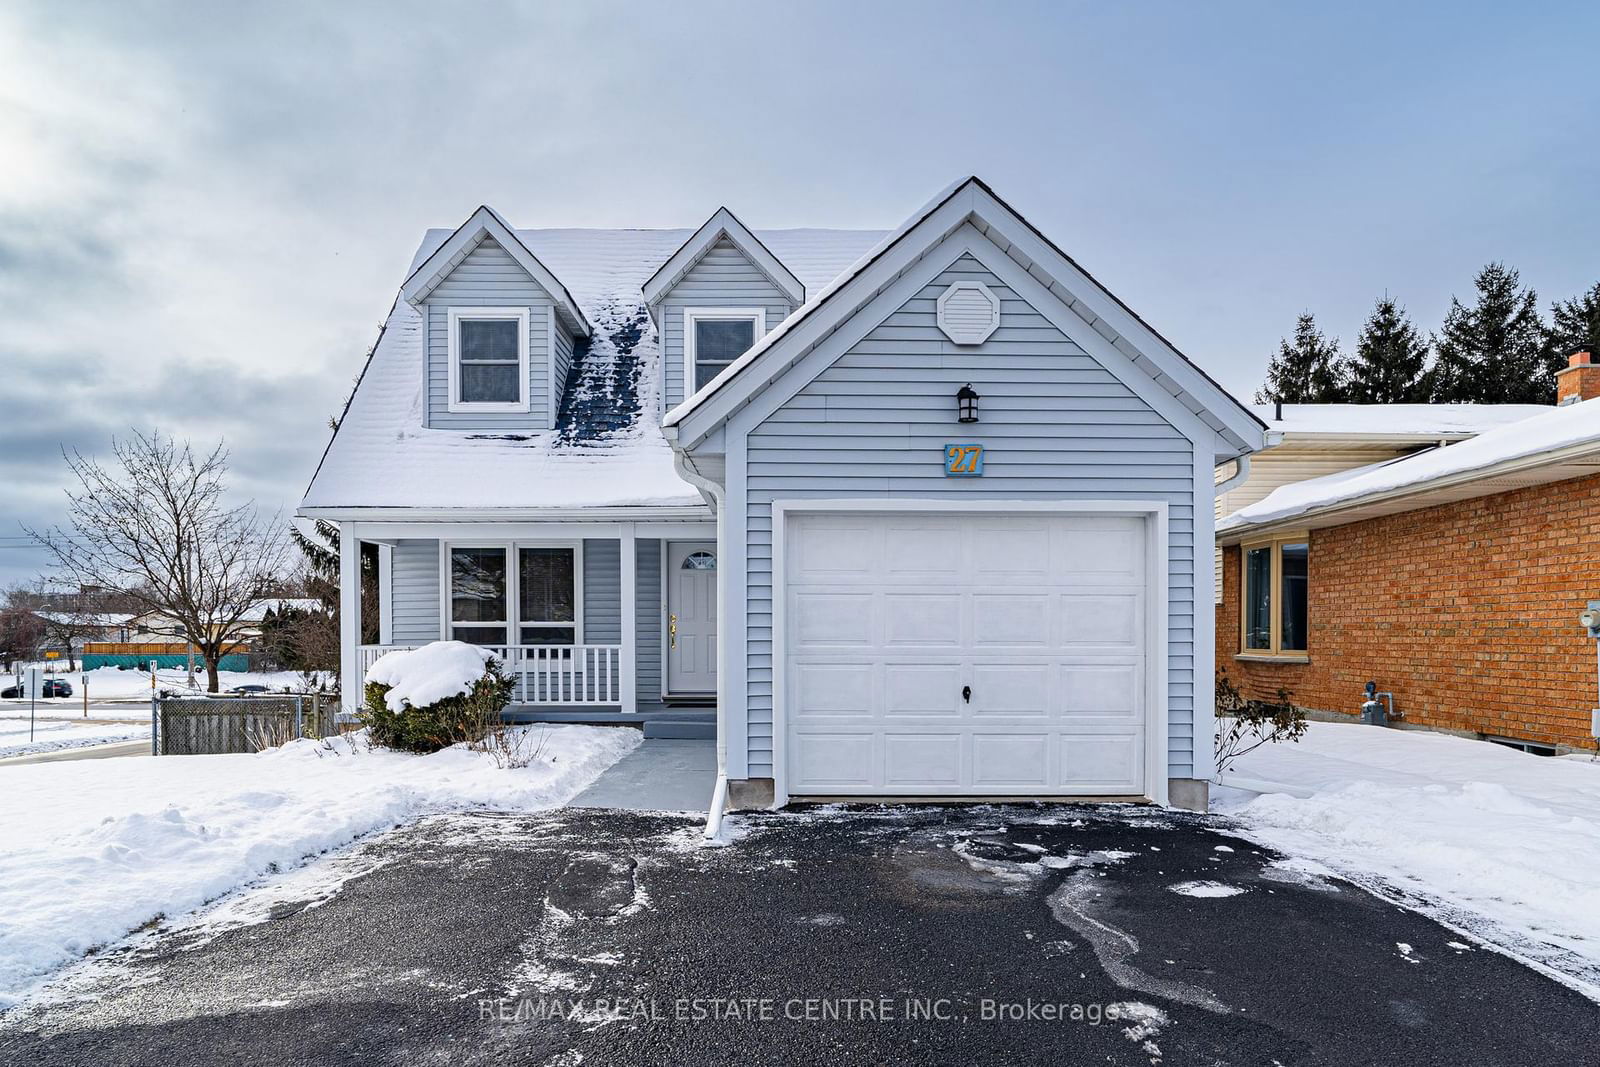
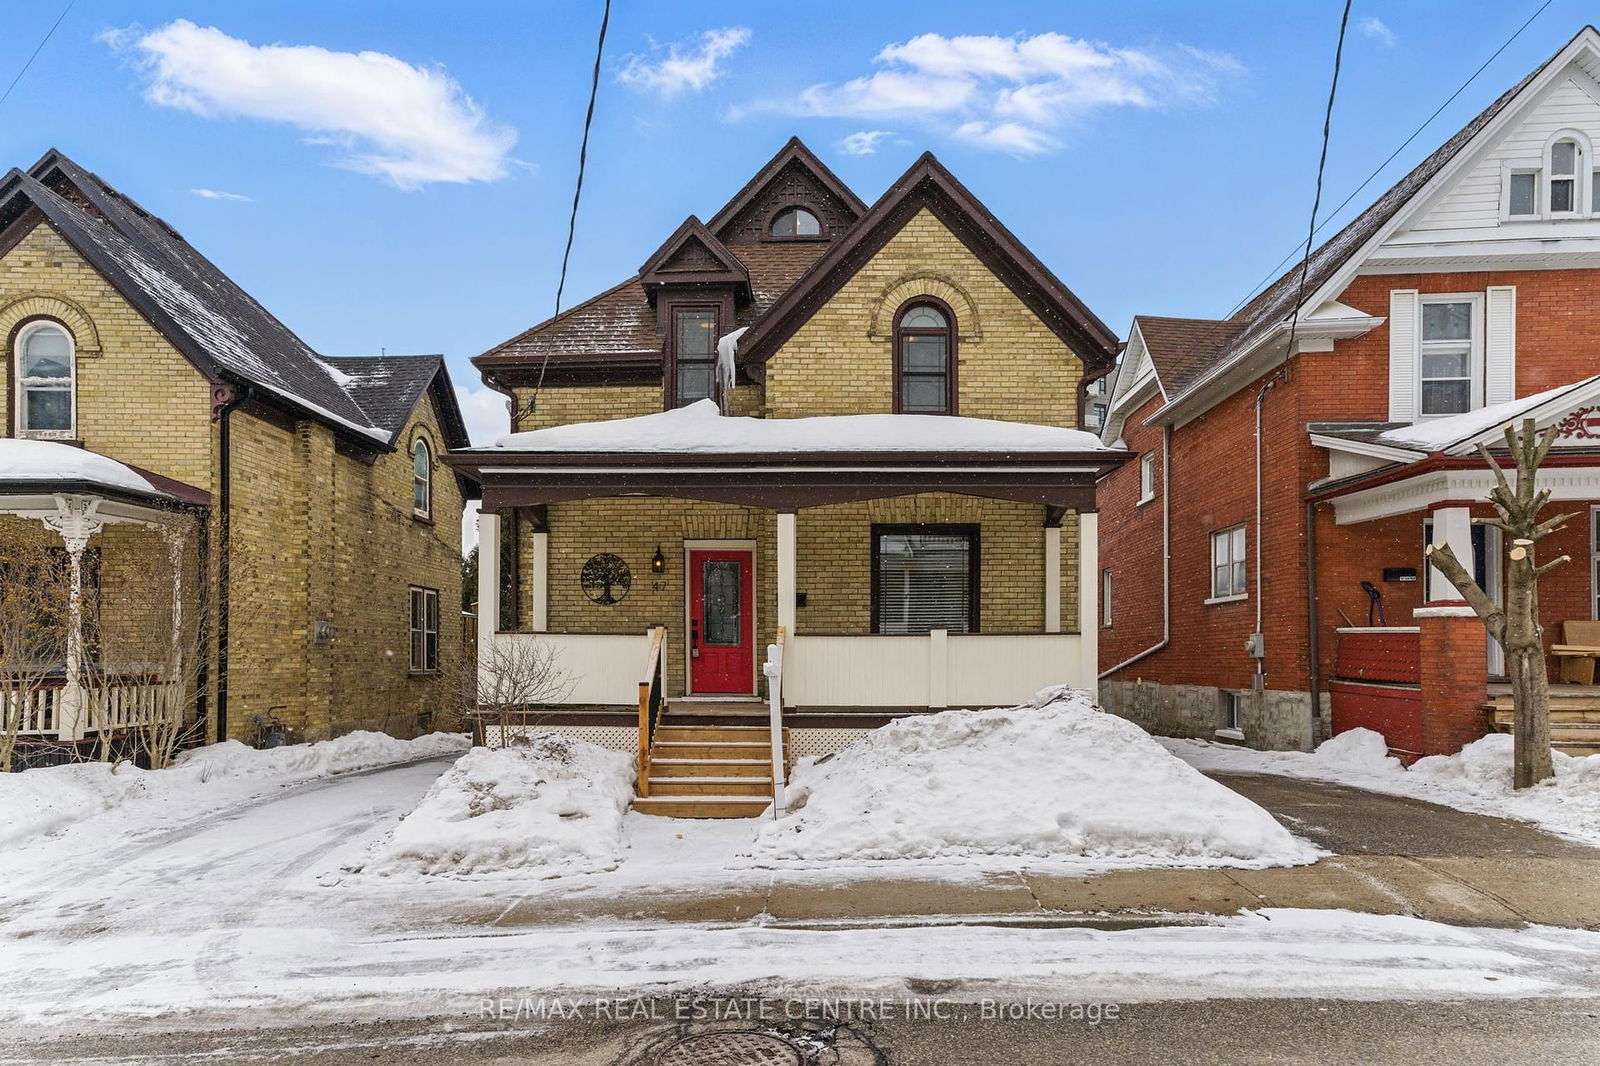
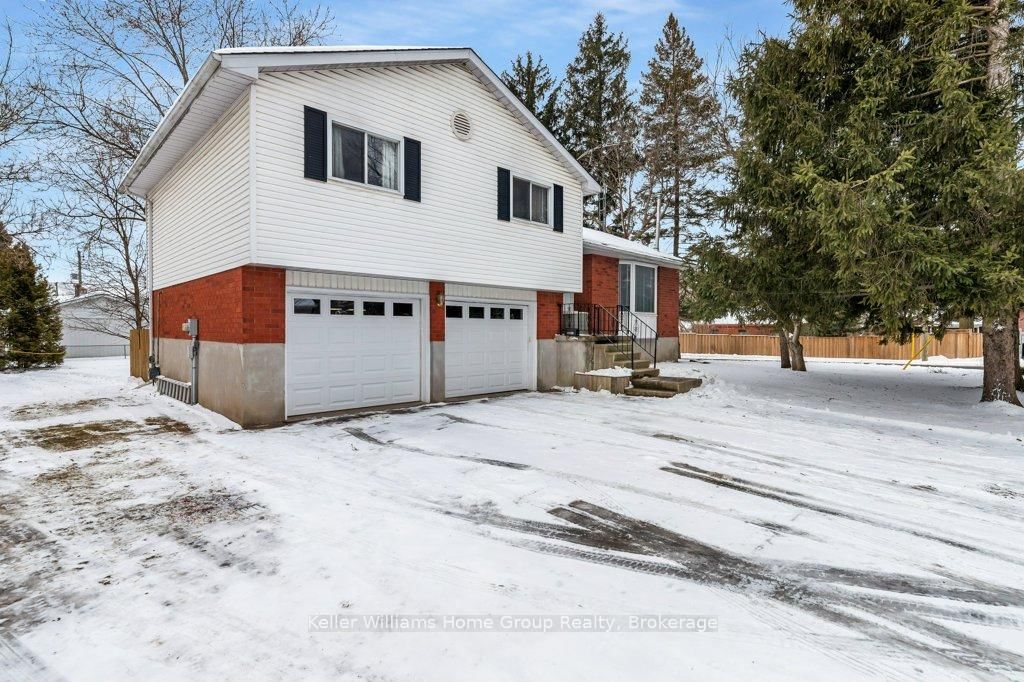
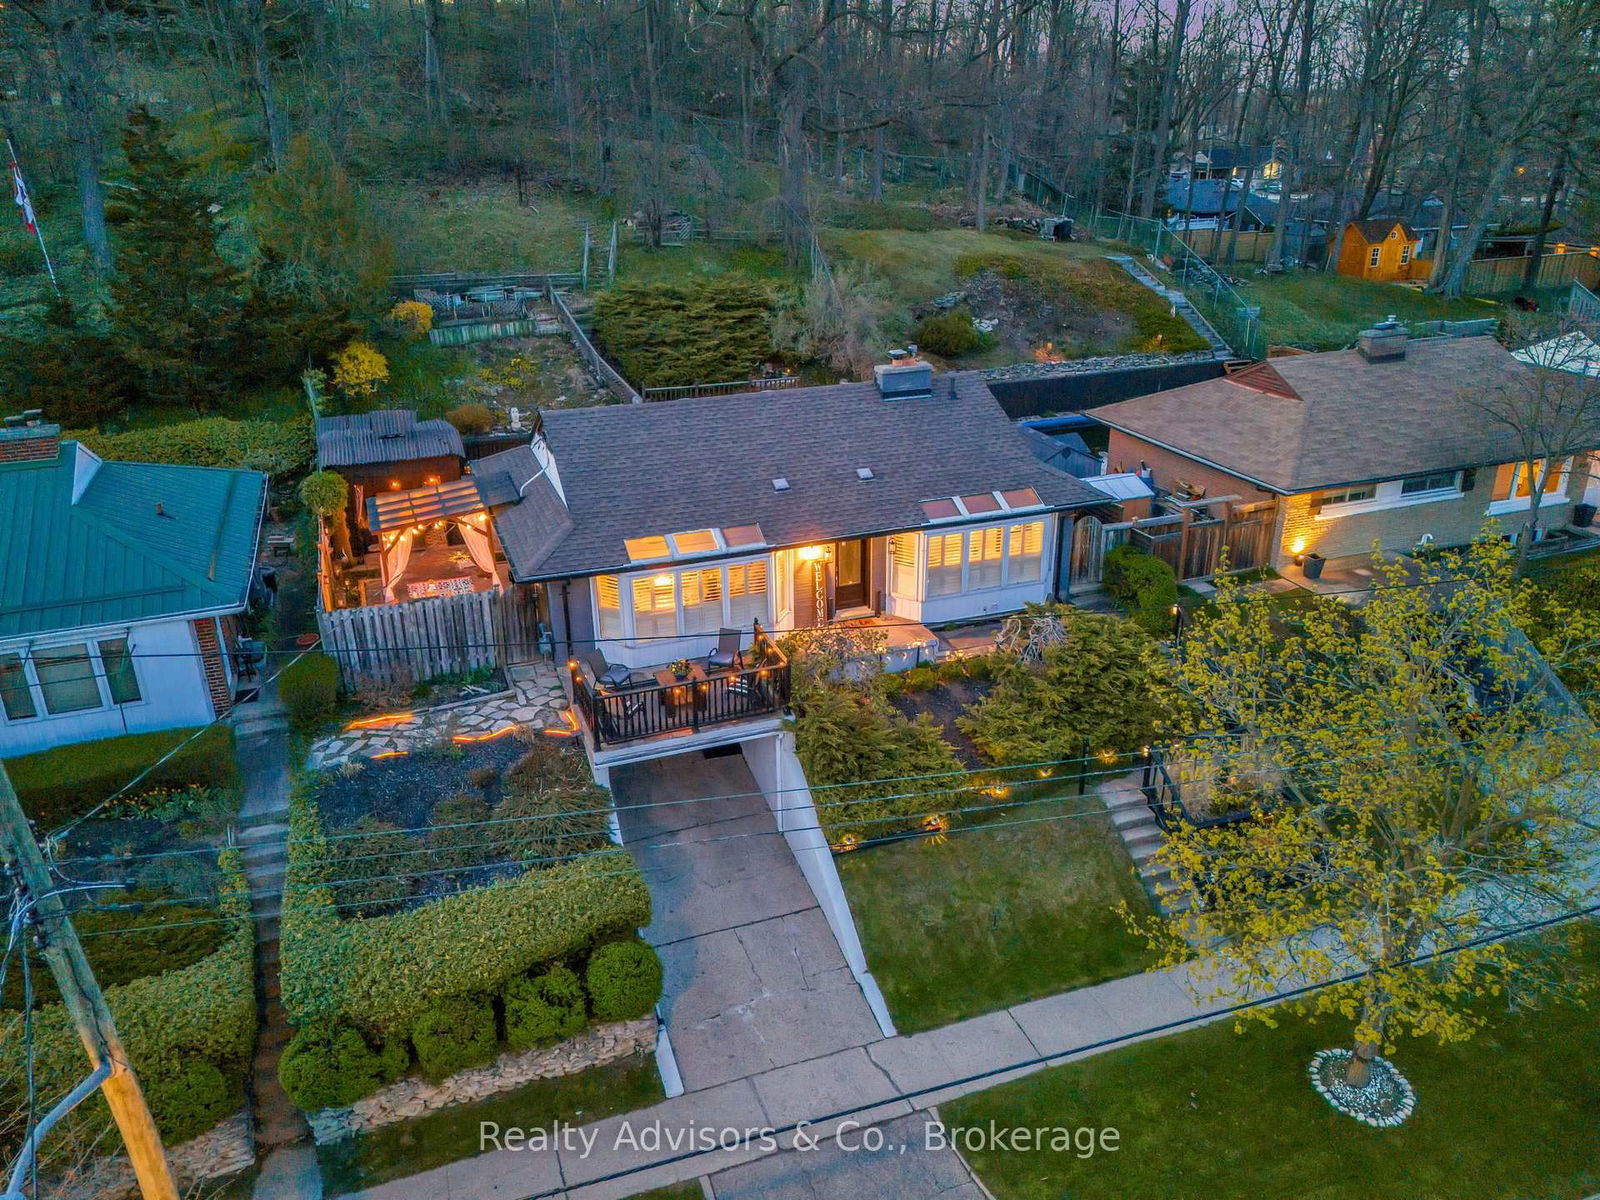
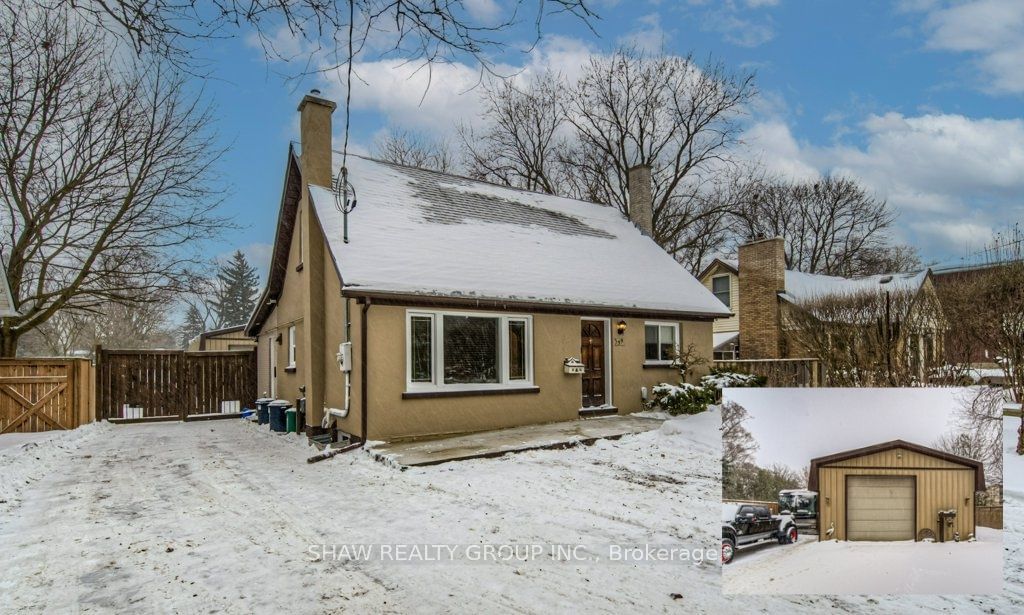
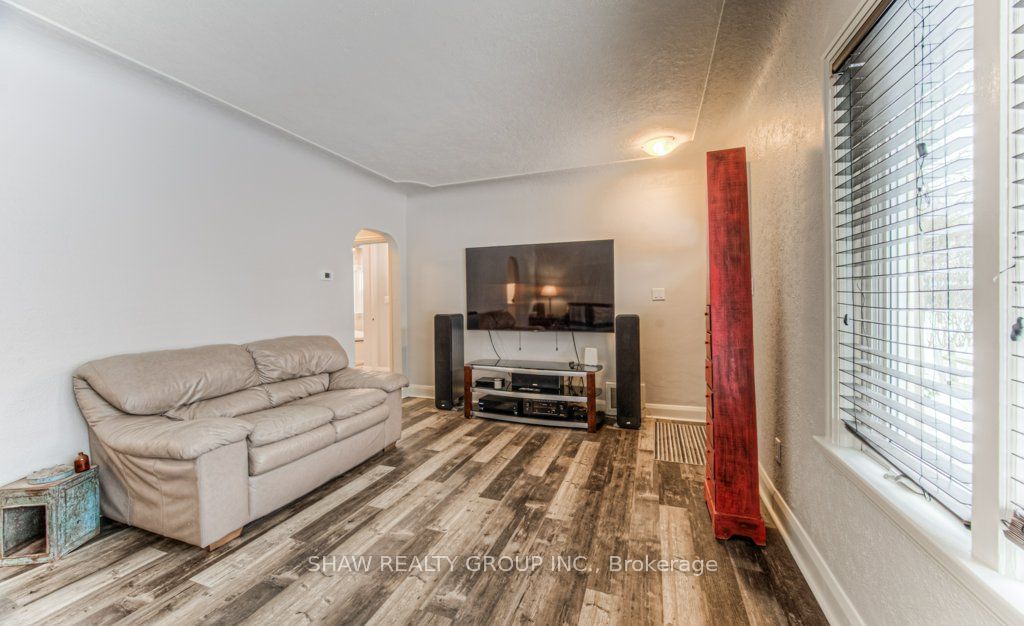
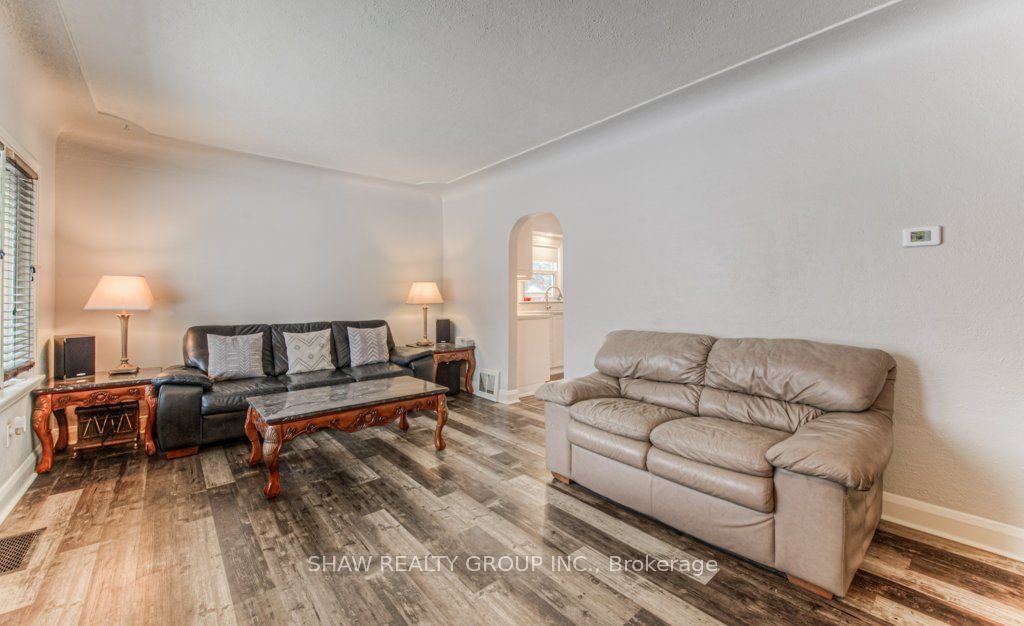
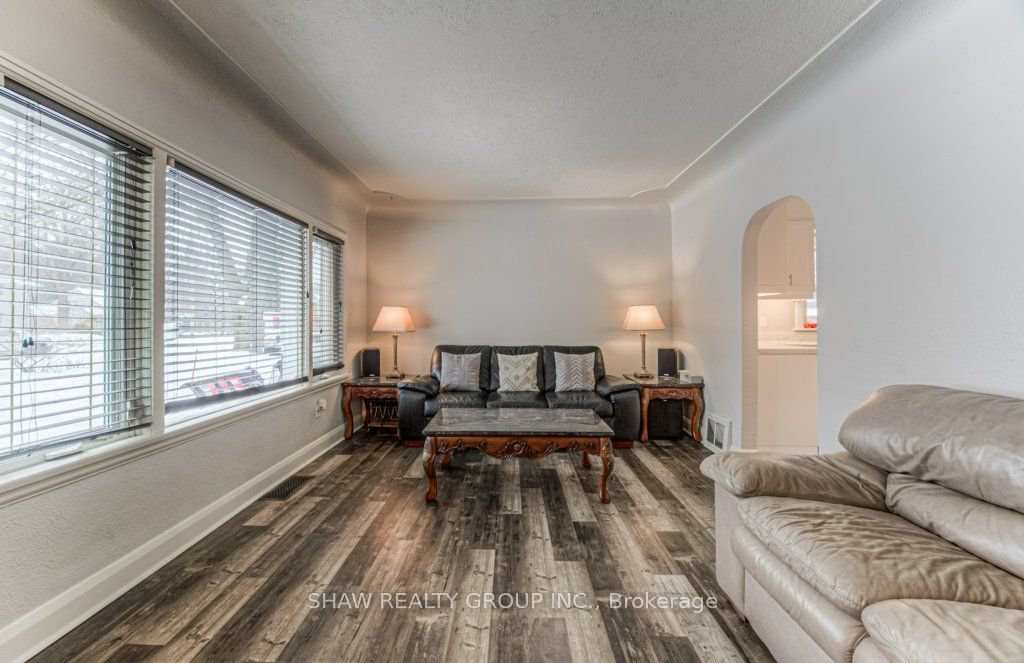
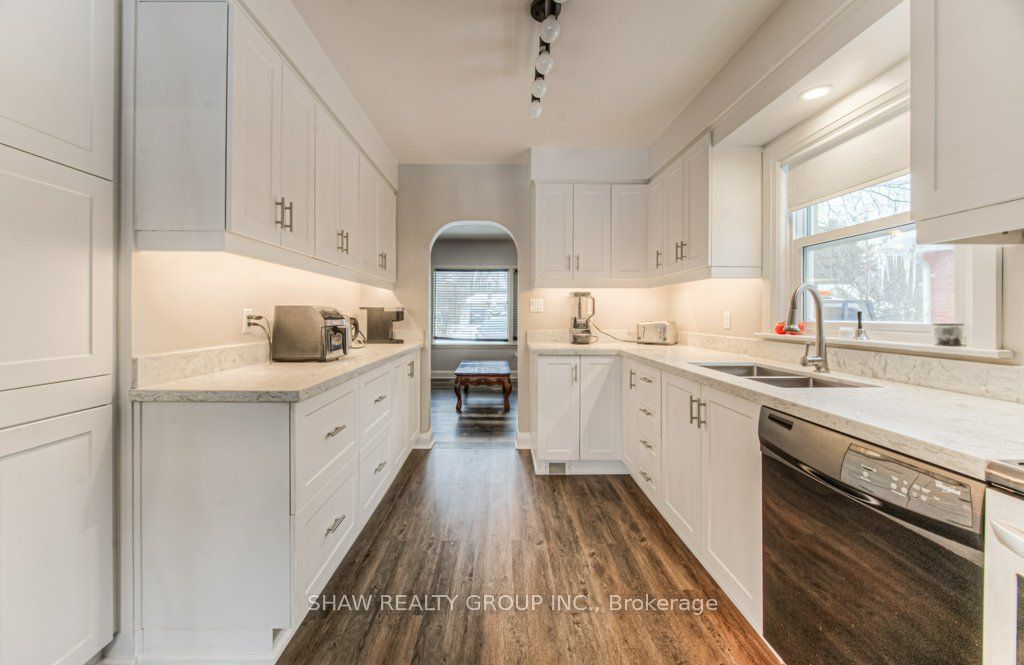
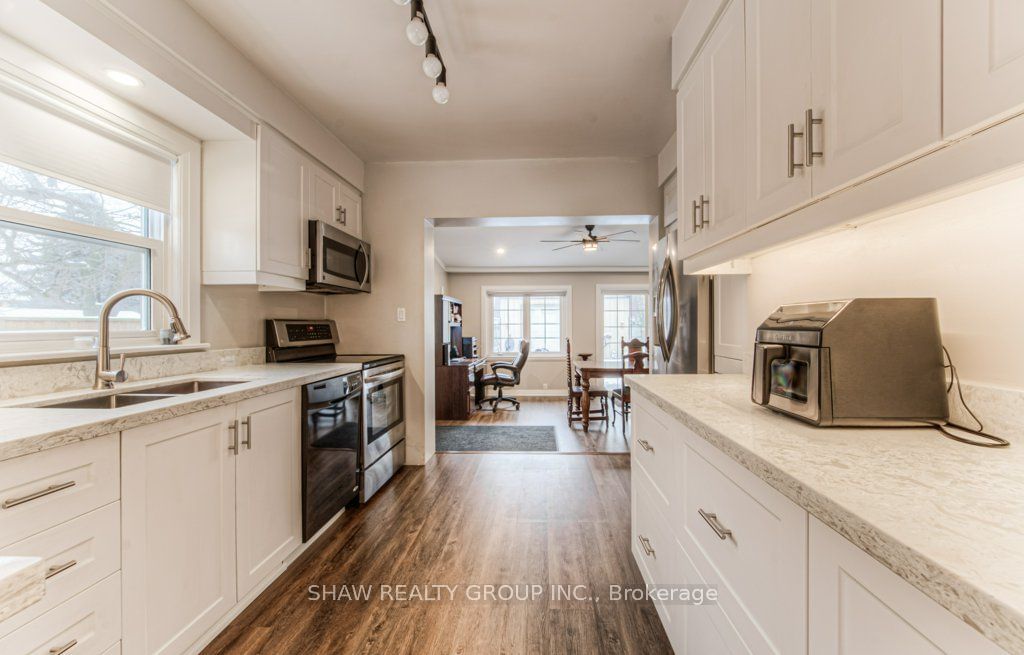
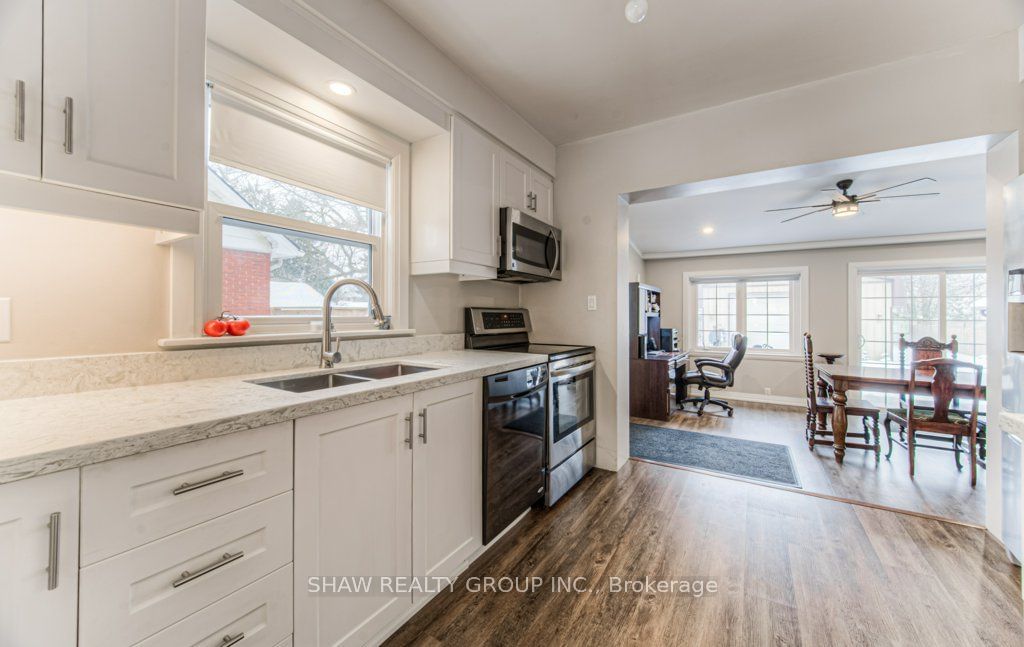
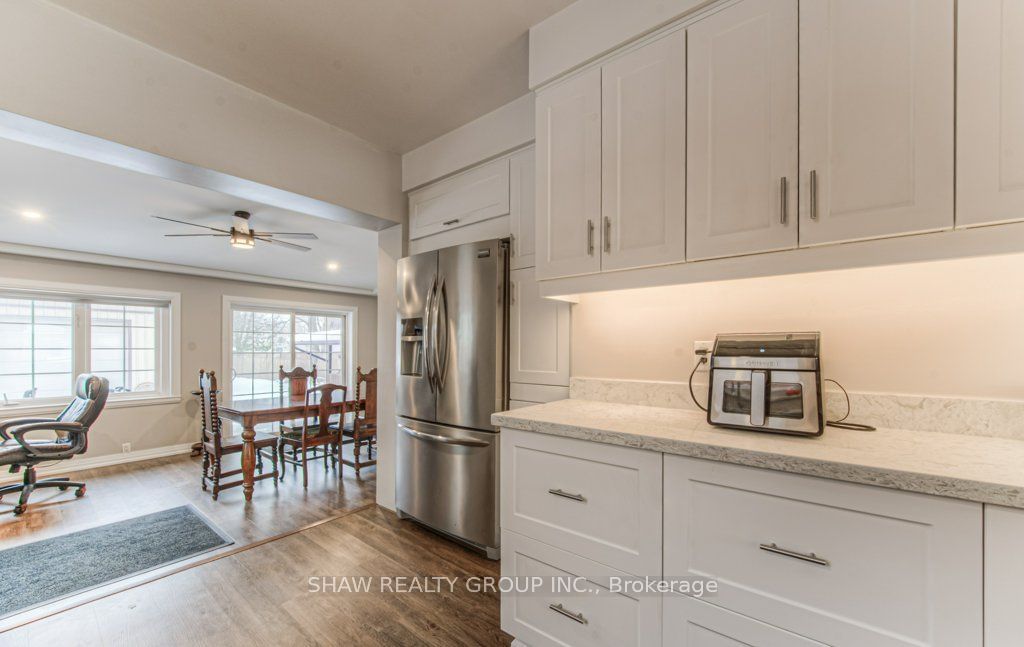
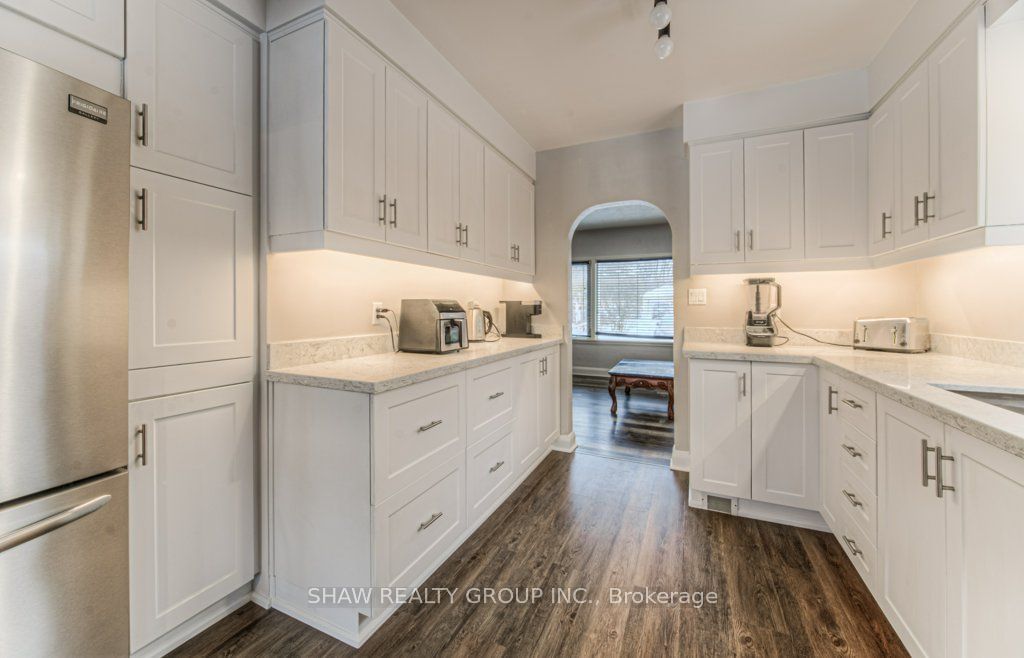
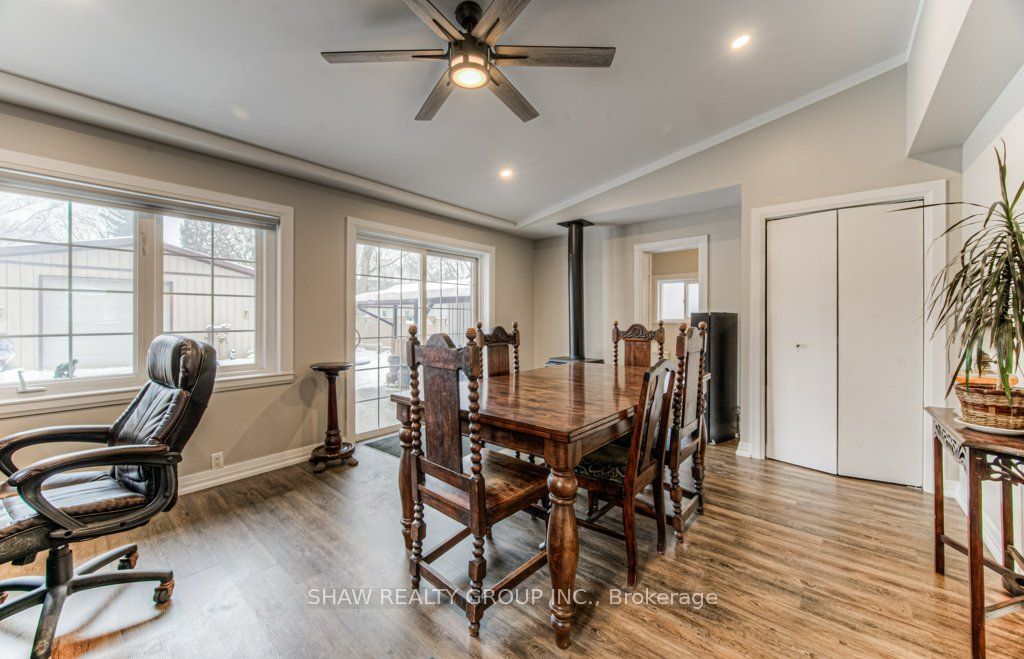
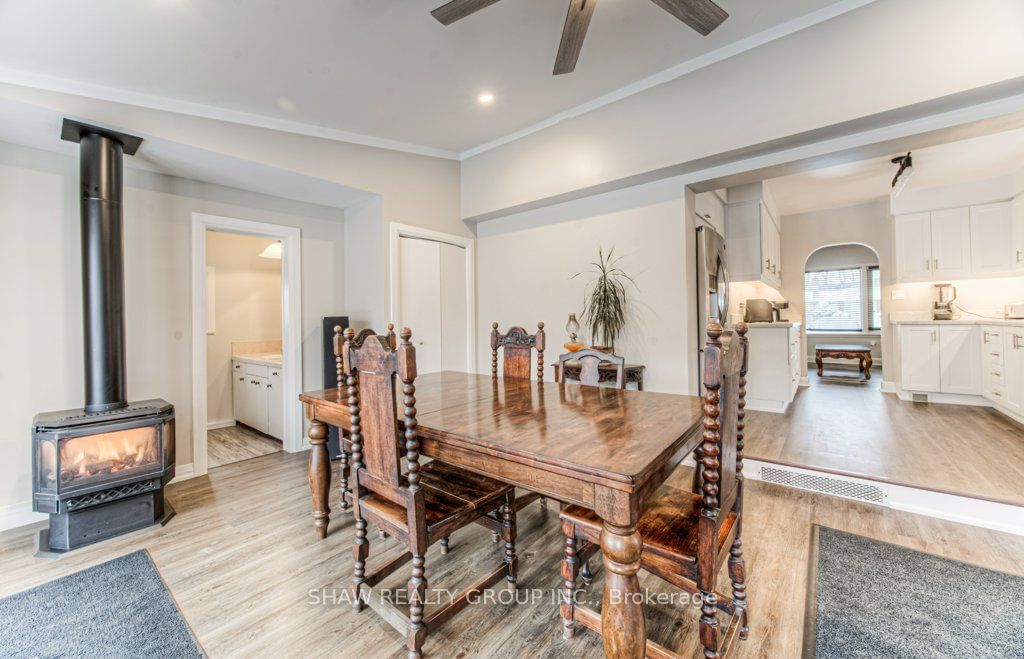
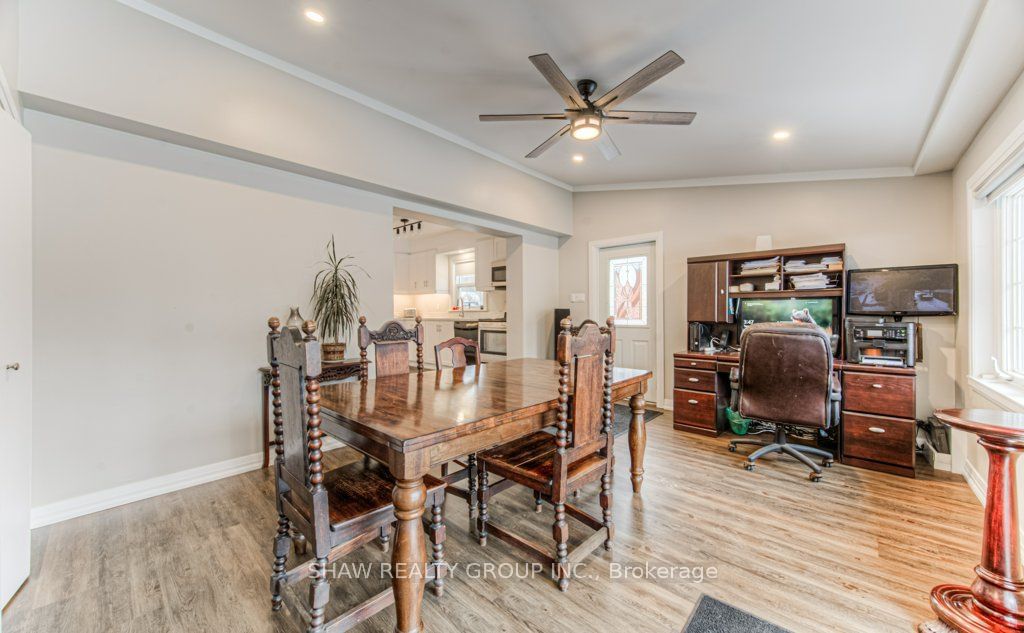
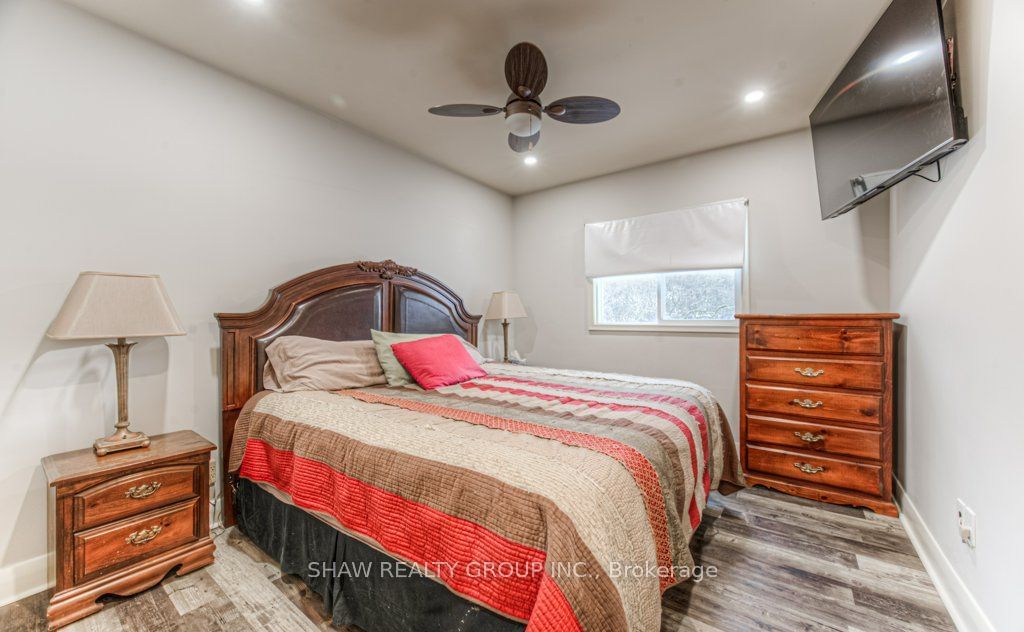
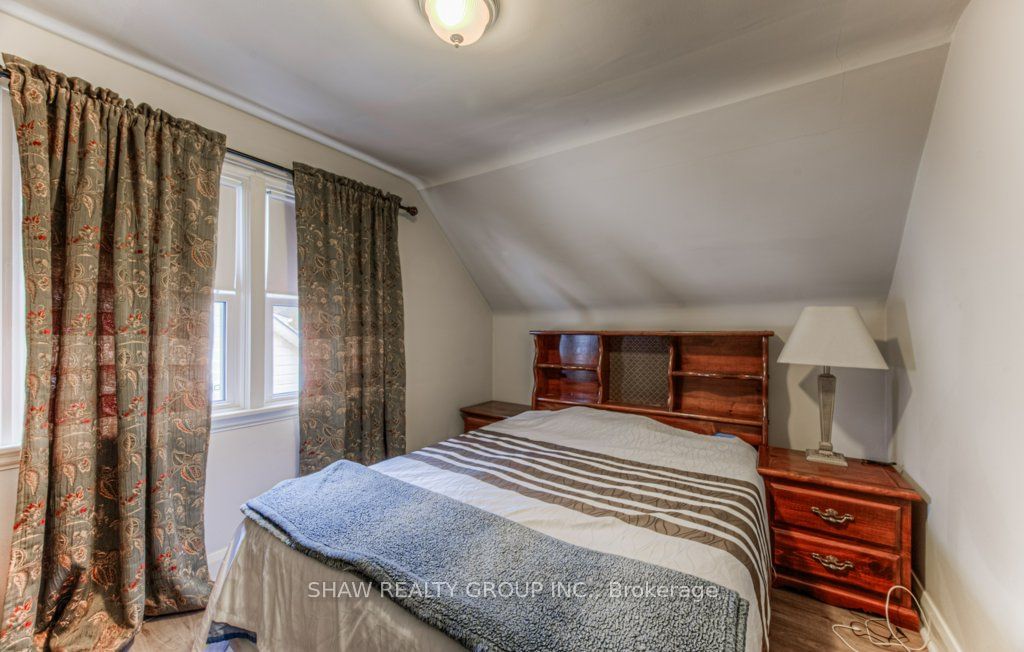
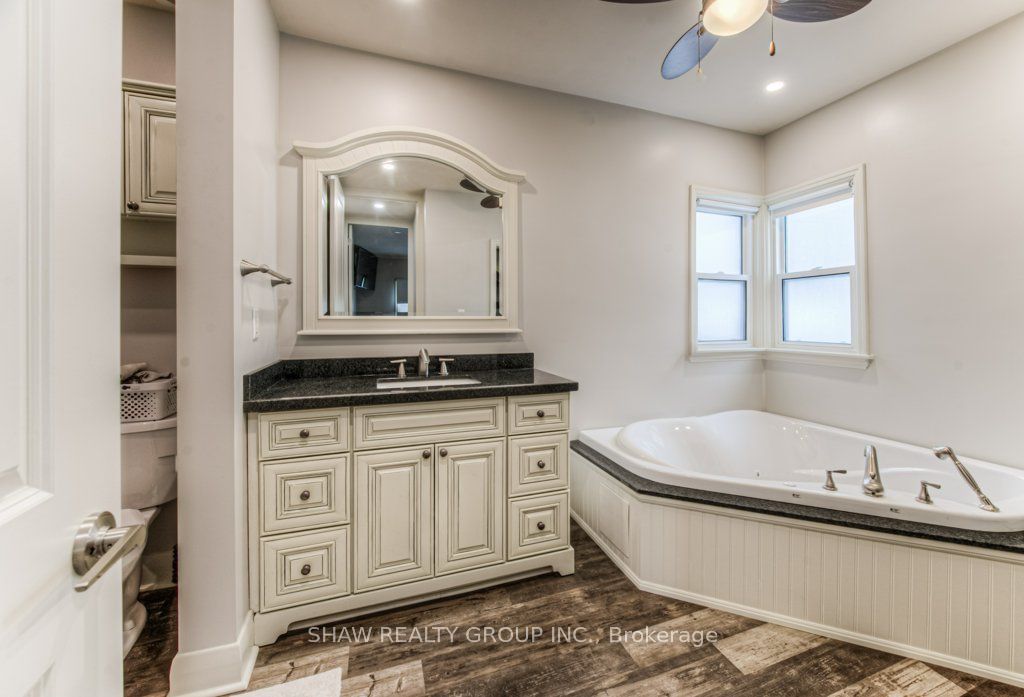
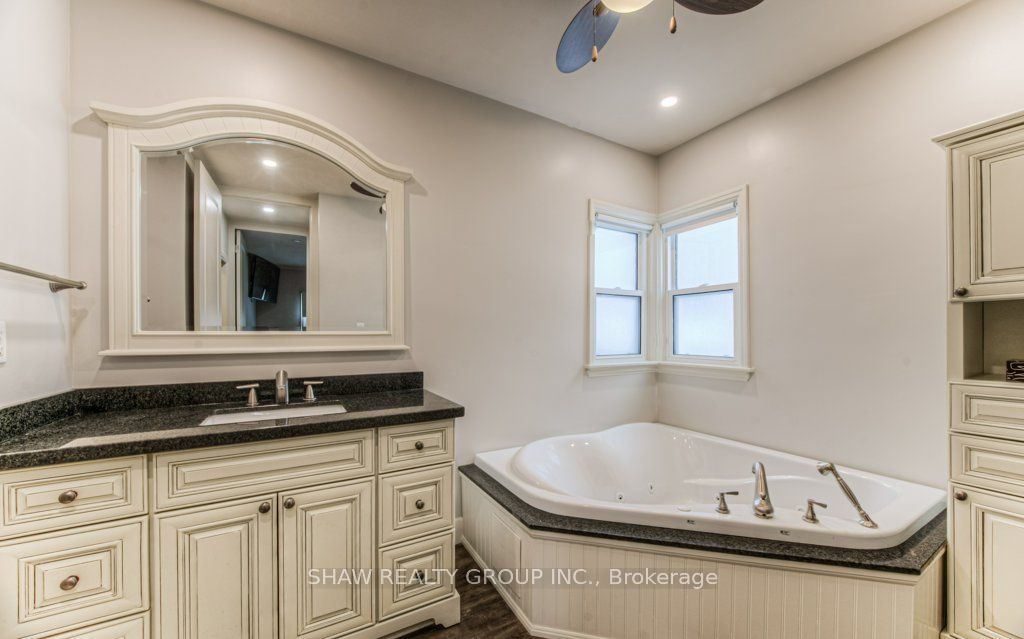
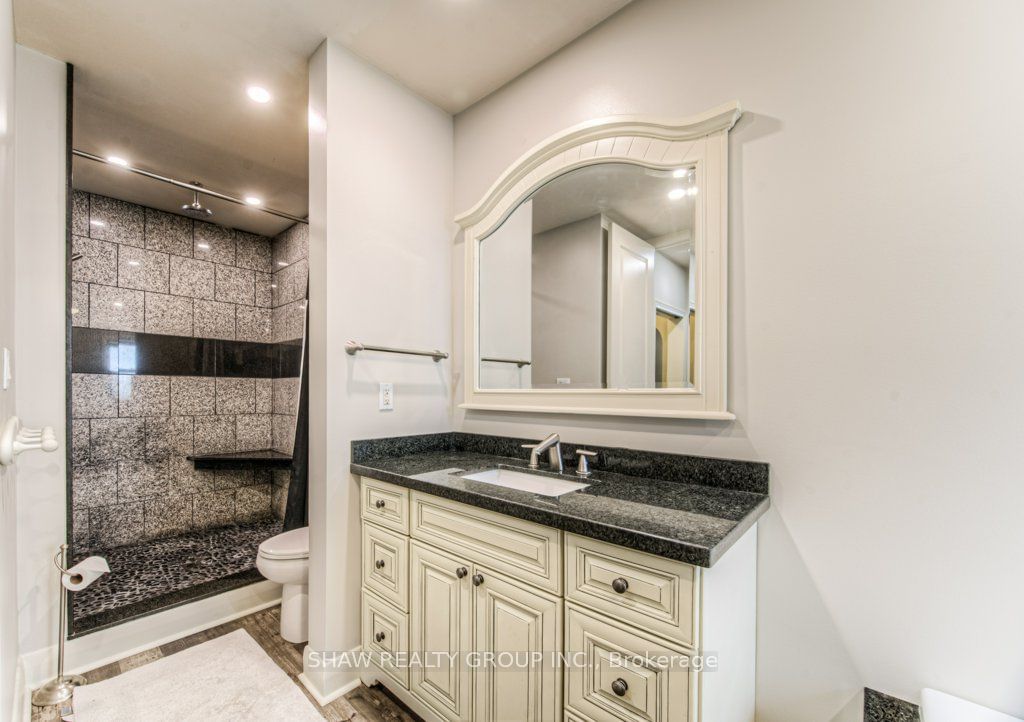
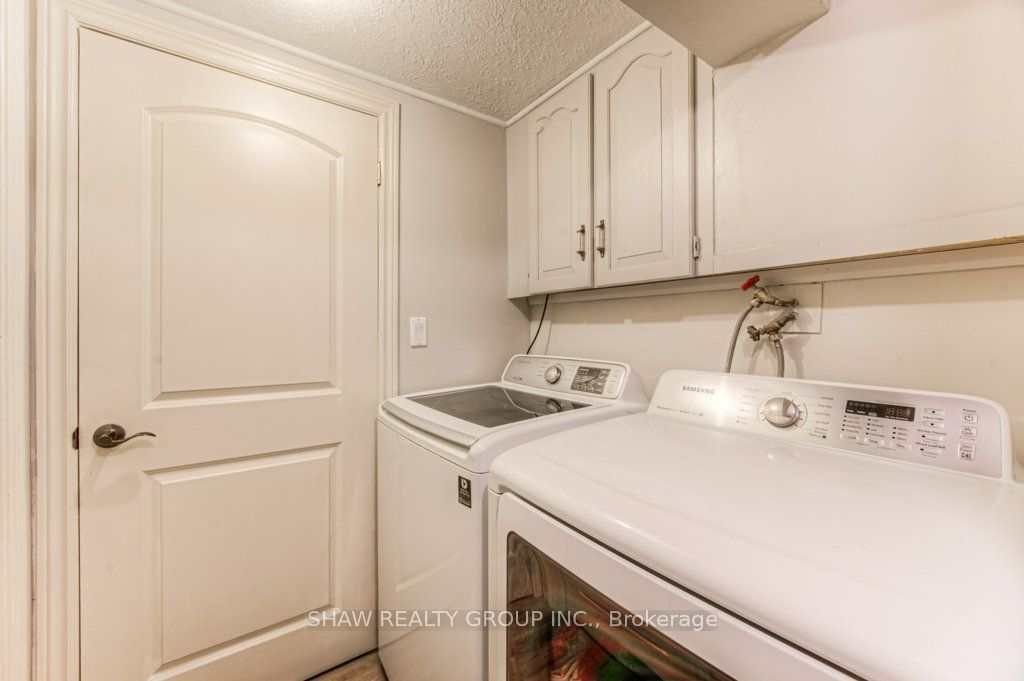
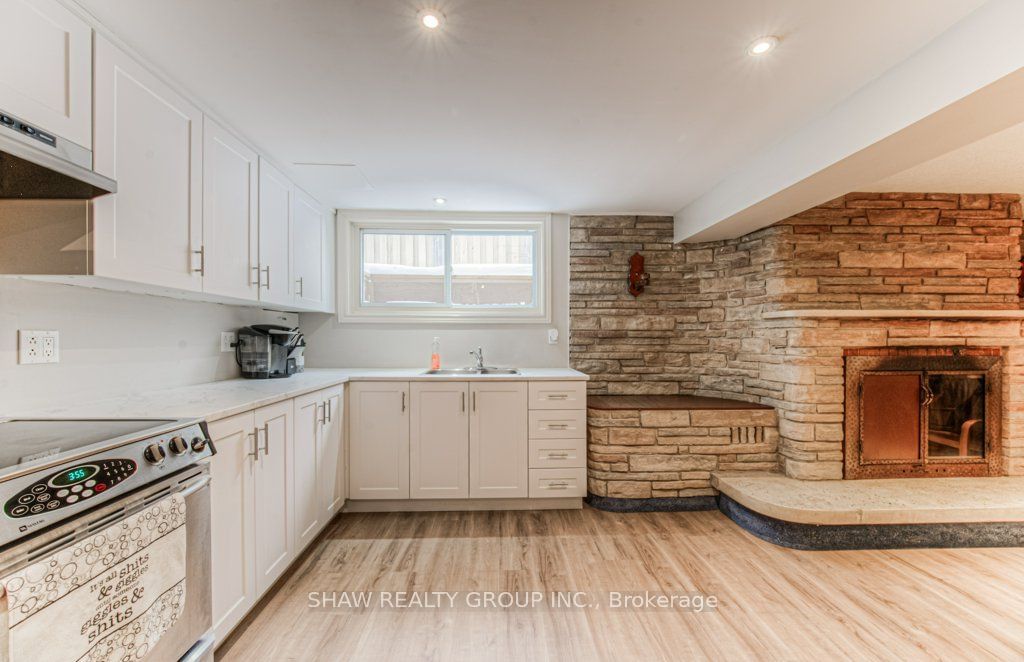
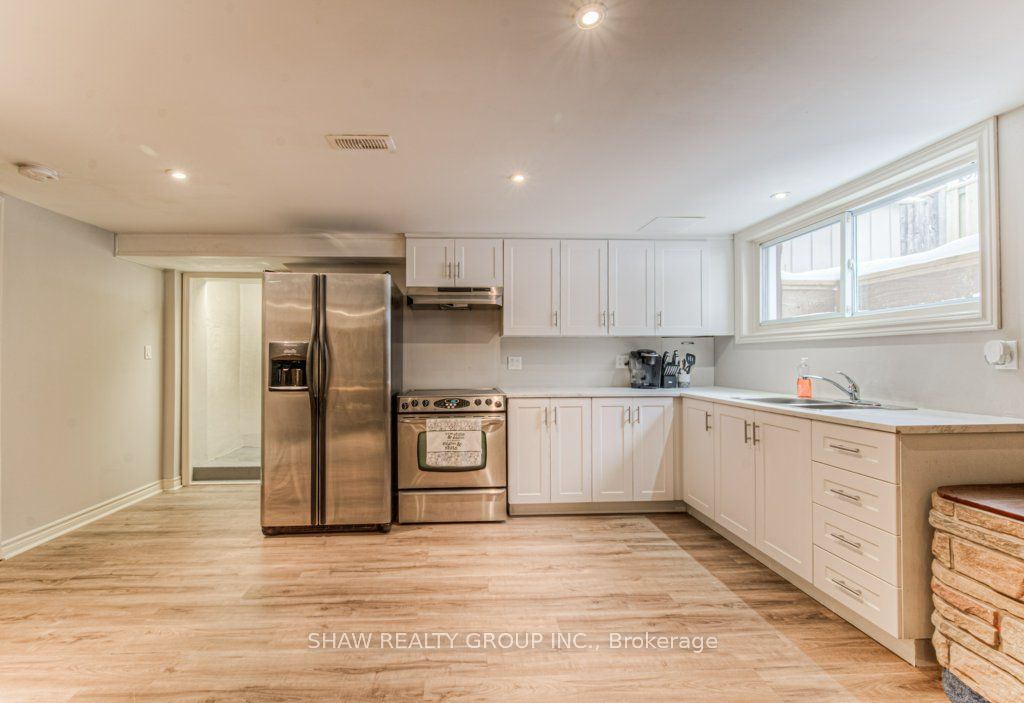
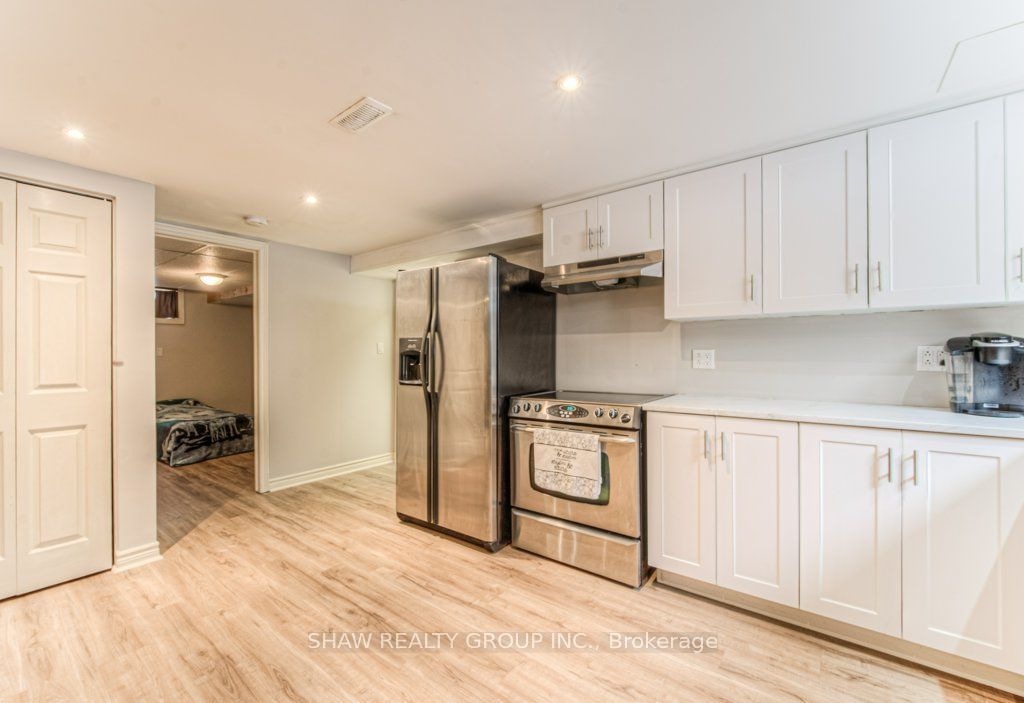
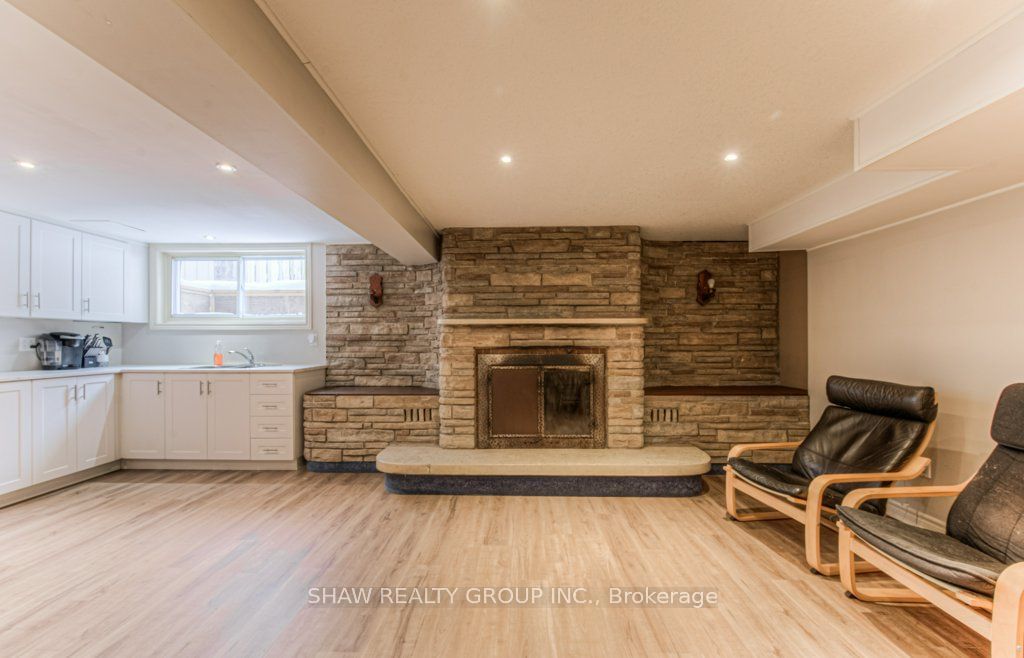
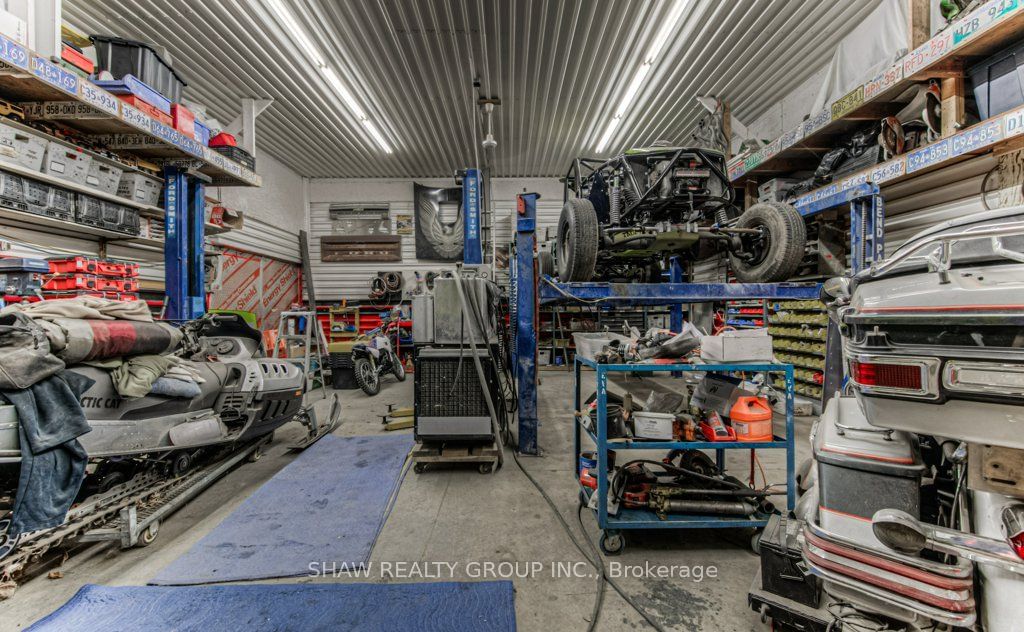
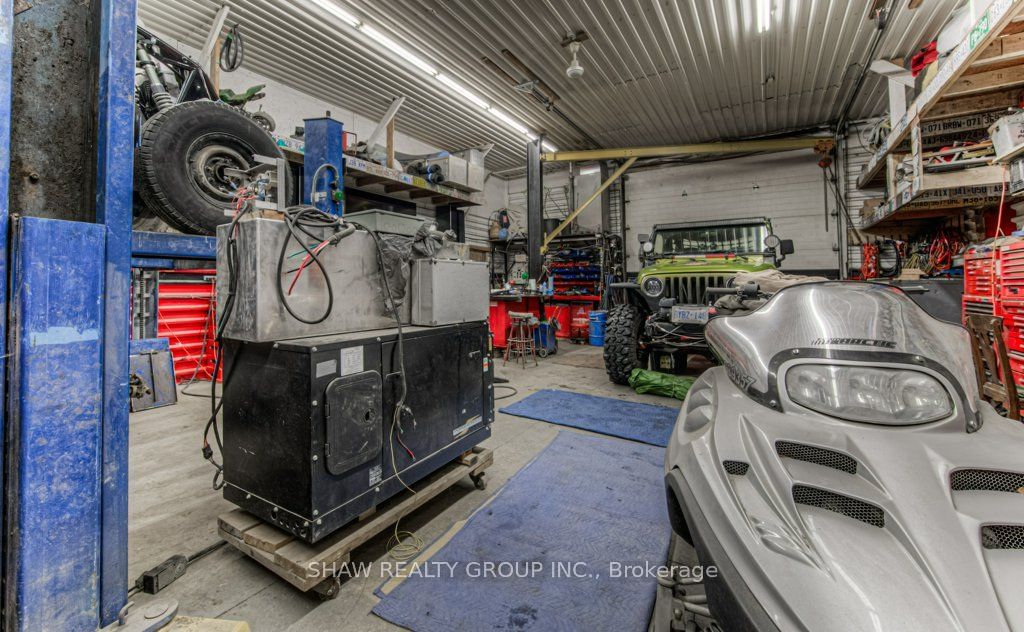
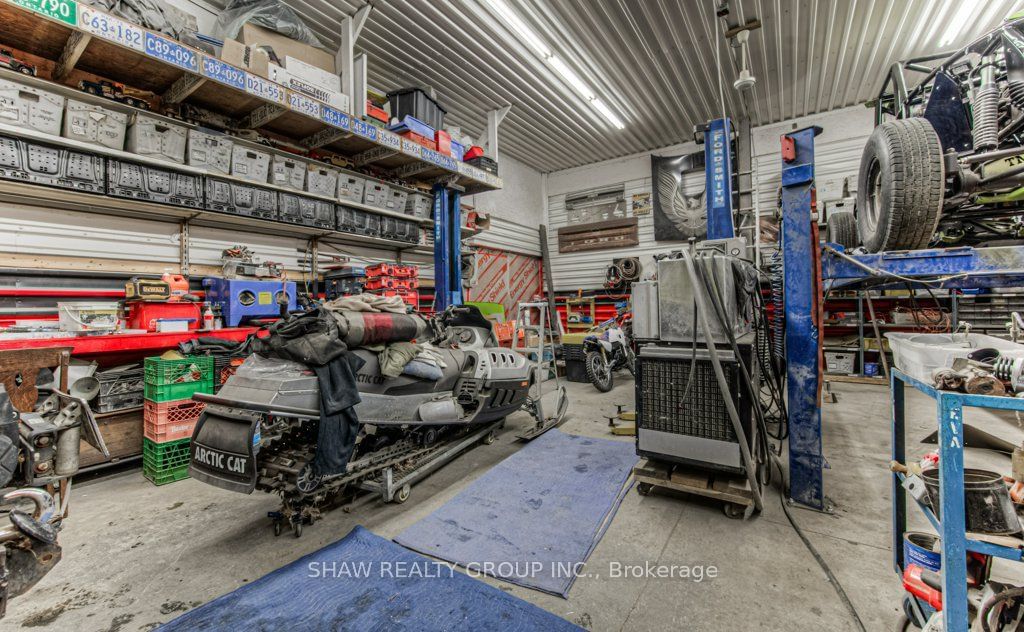
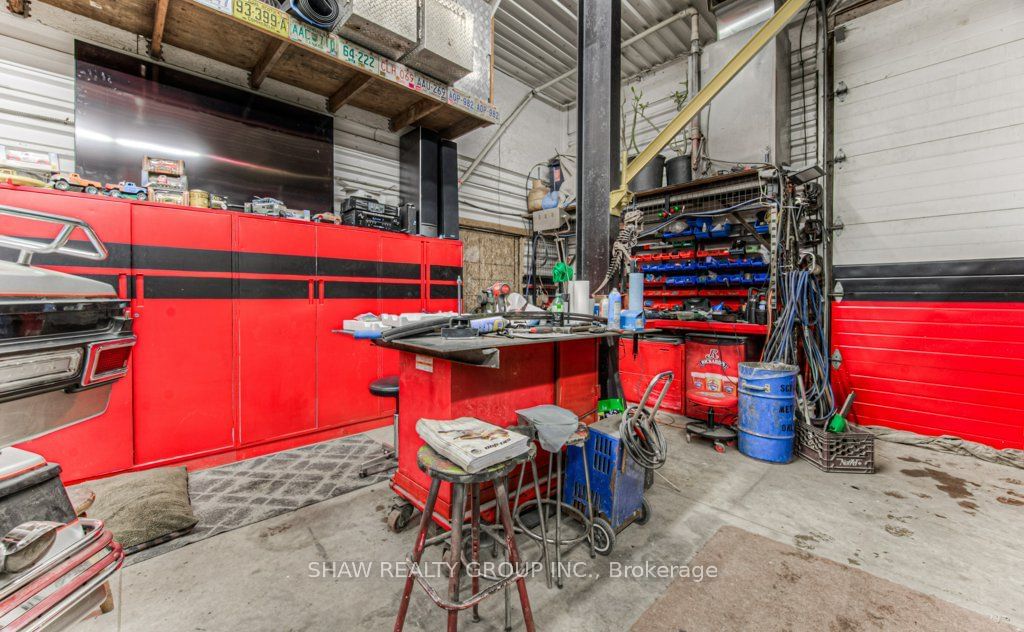
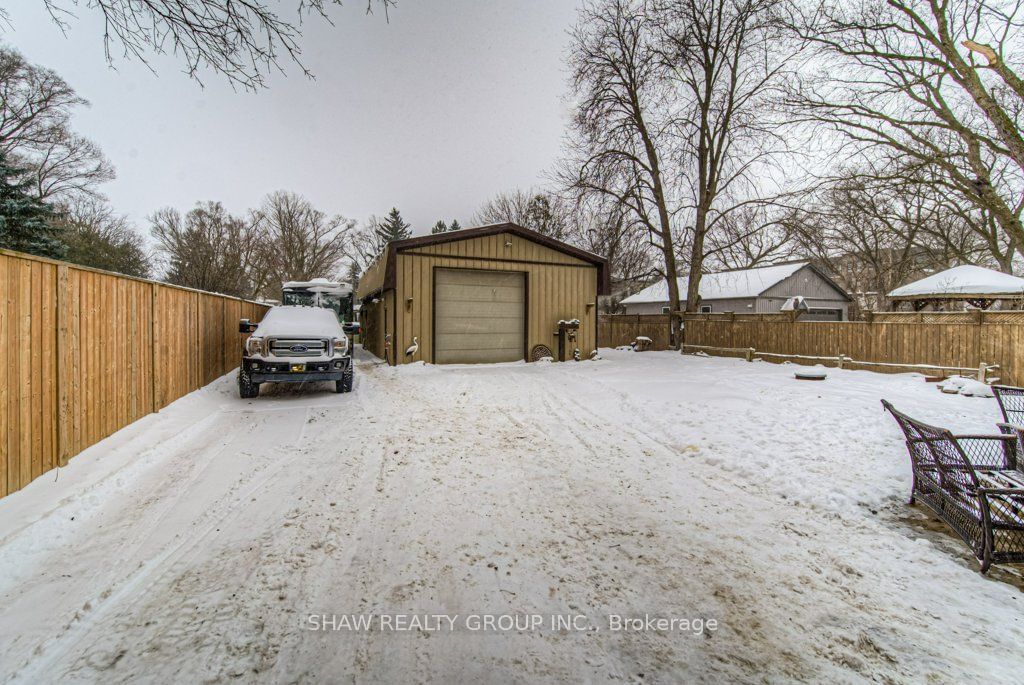
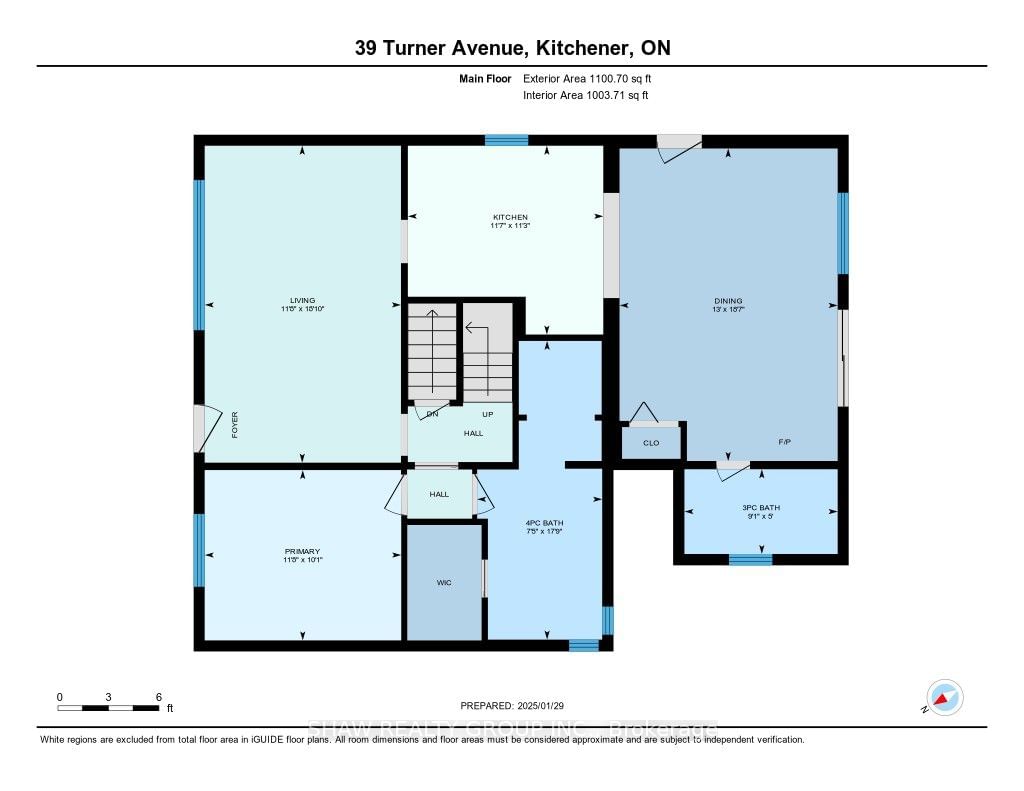
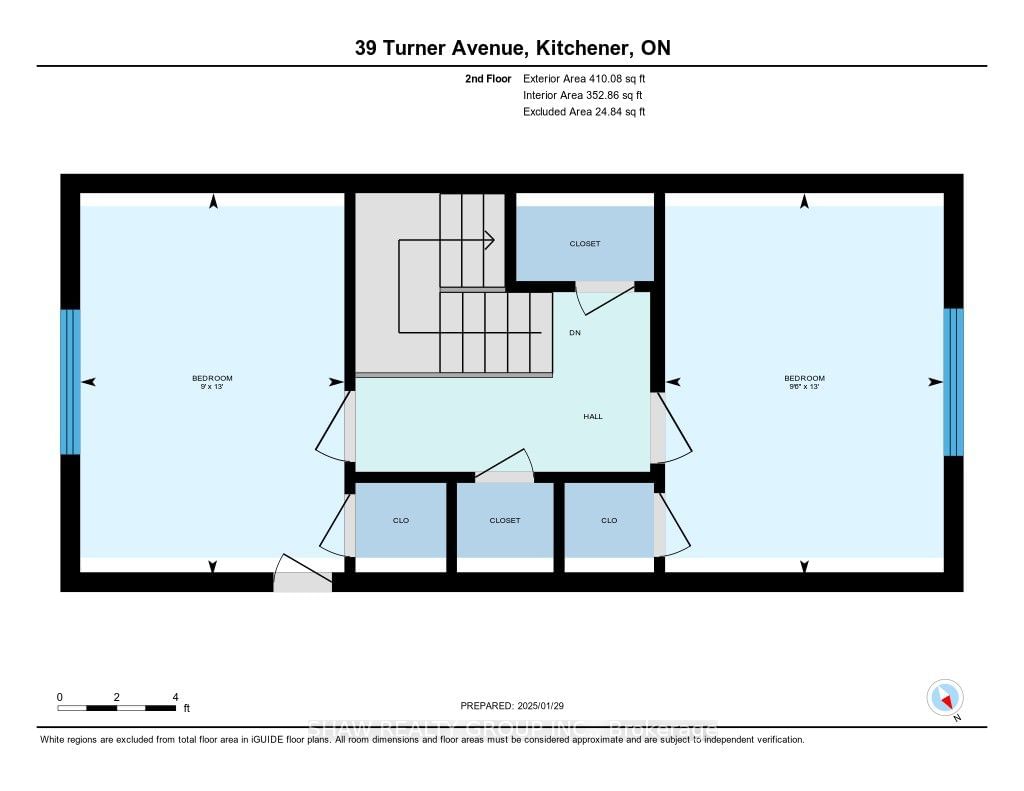
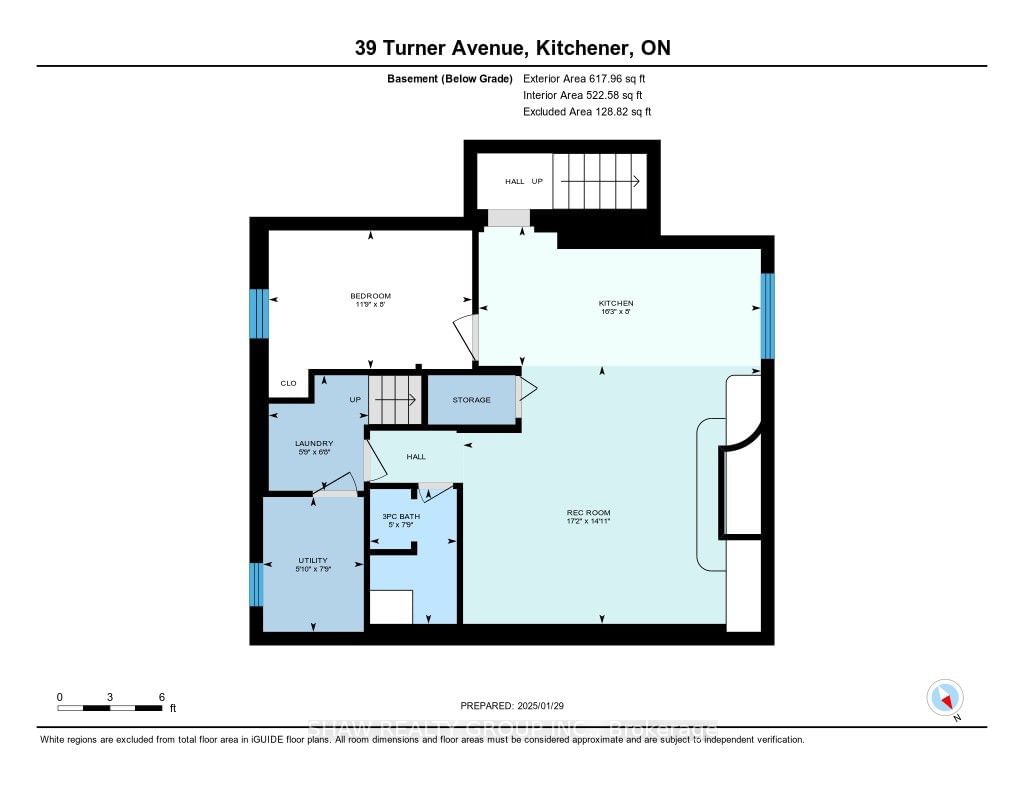
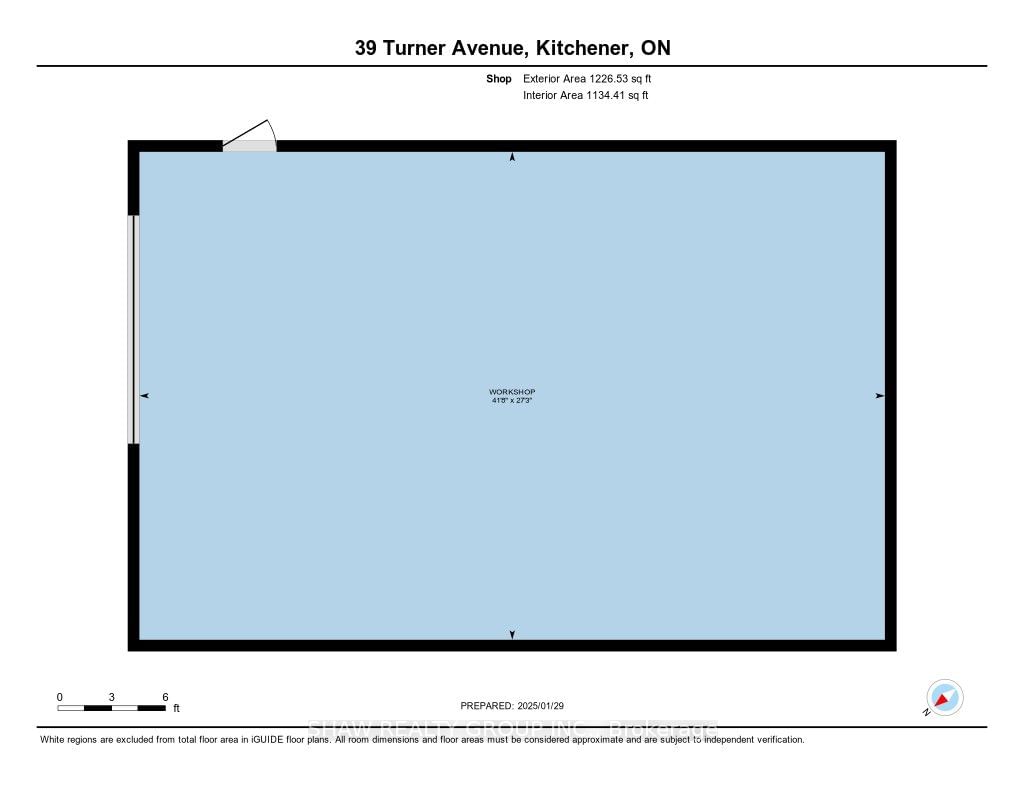
39 Turner Ave, Kitchener - Rare Opportunity! Located just before Frederick meets Victoria St, this beautifully updated bungalow loft sits on an incredible 60' x 200' lot with a dream workshop and flexible closing date! The main floor features a primary bedroom with a luxury ensuite and walk-in closet, while the upper level offers two additional bedrooms with 5' x 29' crawl spaces for extra storage. A dining room addition includes a patio door walkout and a brand-new gas stove. The basement in-law suite comes with a separate entrance (both inside and outside), a one-bedroom setup, a wood-burning fireplace, and potential to be used as a daycare space. The 42' x 28' steel workshop is a standout feature, boasting 13'6" height, 100-amp service, a 12' x 12' garage door, insulation (R20 walls, R40 ceiling), heating, and an overhead crane, making it ideal for a car hobbyist, home business, or additional storage. The expansive outdoor space provides ample parking for 20+ vehicles, RVs, boats, and trailers, along with a 28' x 12' covered storage area behind the shop. Additional amenities include a 20' x 10' storage shed with 30-amp service and shelving, a 20' x 10' covered patio with an outdoor kitchen, and a fully fenced yard for kids or pets. Recent updates include new windows, two new kitchens (2022), gas furnace (2017), water heater (2022), new flooring (2022), a roof (~4 years old), and A/C (~5 years old). The property also features 12 exterior lights on timers and eight security cameras. This home has been meticulously maintained and updated by a contractor for the past 24 years to ensure a move-in-ready experience for the next owner. **R4 Zoning See supplement for details.** Dont miss out on this one-of-a-kind property! **EXTRAS** Shop Equipment Negotiable.
Built-in Microwave, Carbon Monoxide Detector, Dishwasher, Hot Water Tank Owned, Refrigerator, Smoke Detector, Stove, Washer, Window Coverings, Other, Negotiable
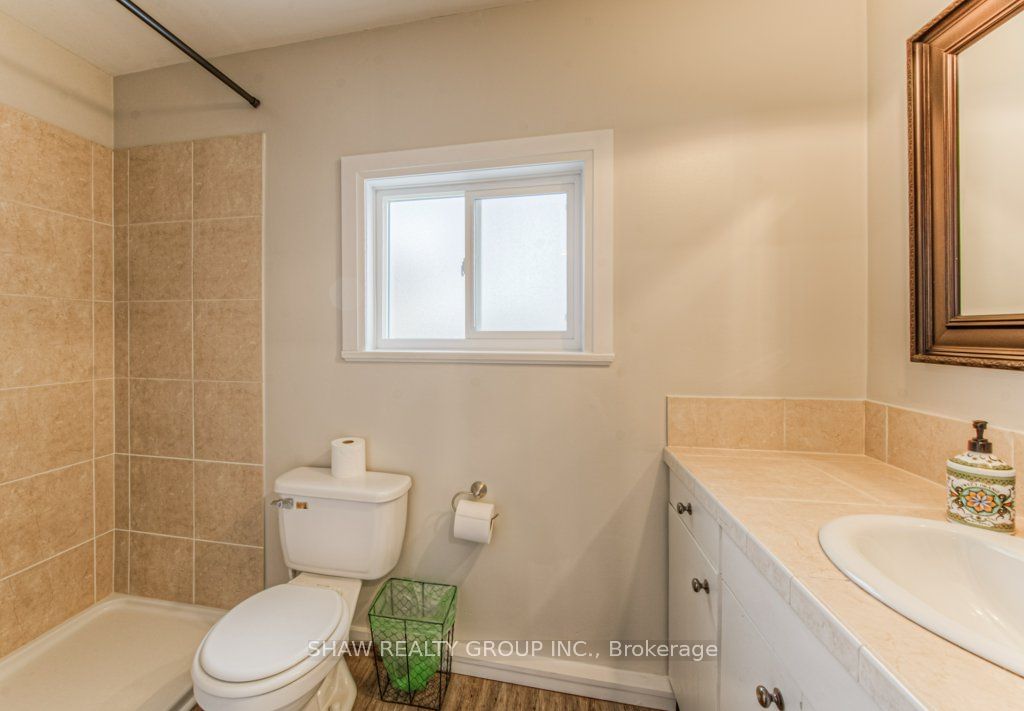
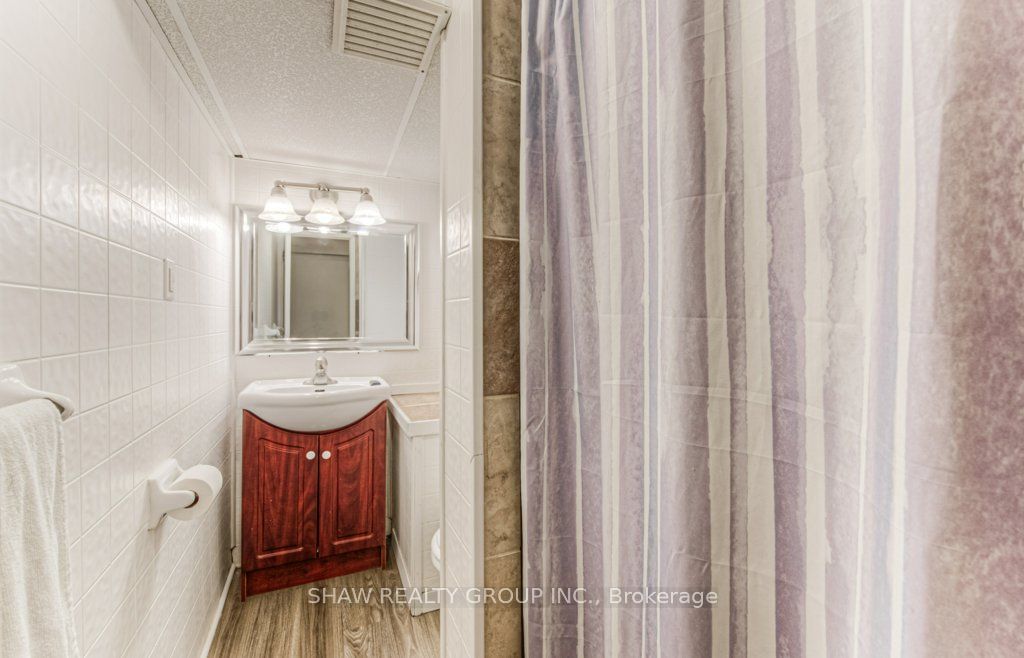
Bathroom
Bathroom
Dining
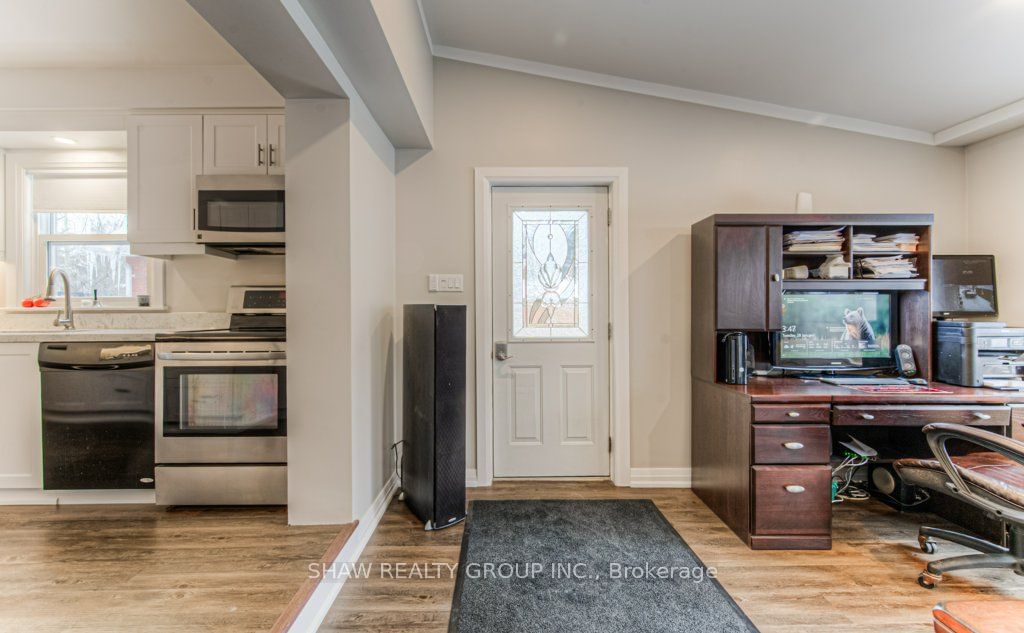
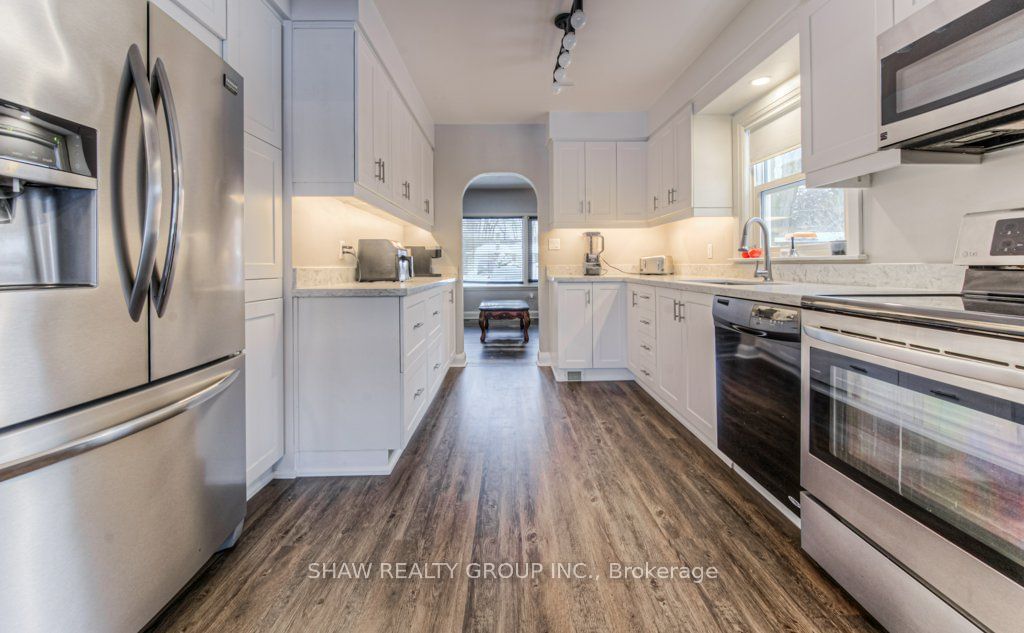
Kitchen
Living
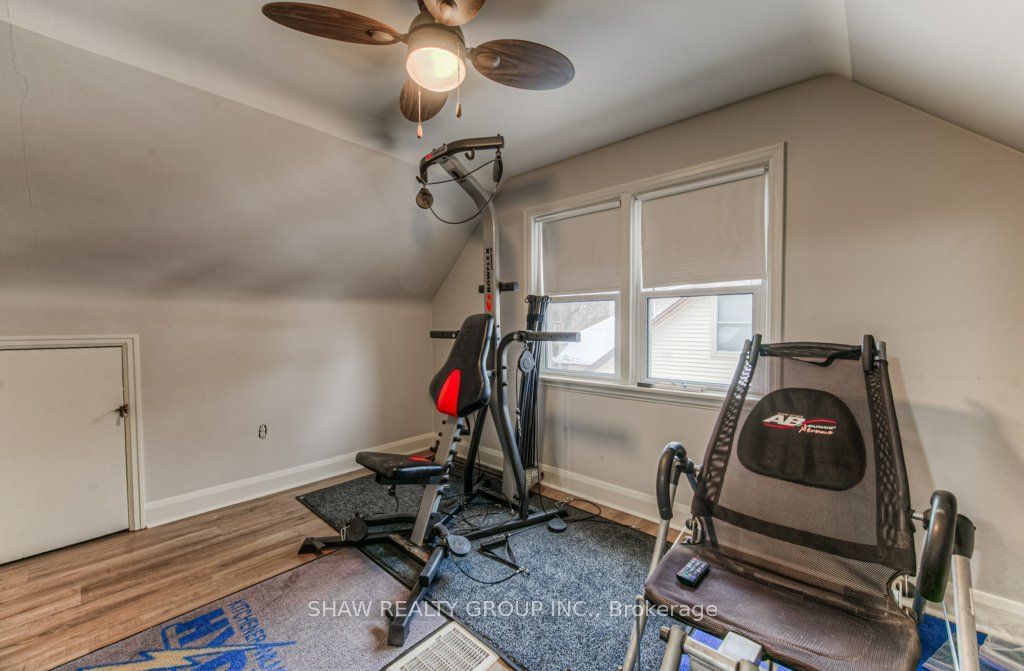
Br
Br
Bathroom
Br
Kitchen
Laundry
Rec
The graph below compares the average list price and average sale price of homes in this neighborhood by month for the last 24 months. When average sale price is greater than average list price, this may suggest a buyer's market. When average sale price is lower than the average list price this may suggest a seller's market.
The graph below illustrates the average days on market for homes in this neighborhood. The yellow area may indicate a buyer's market, the green area may indicate a balanced market and the red area may indicate a seller's market.
Sales Representative, Century 21 People’s Choice Realty Inc., Brokerage
(647) 576 - 2100